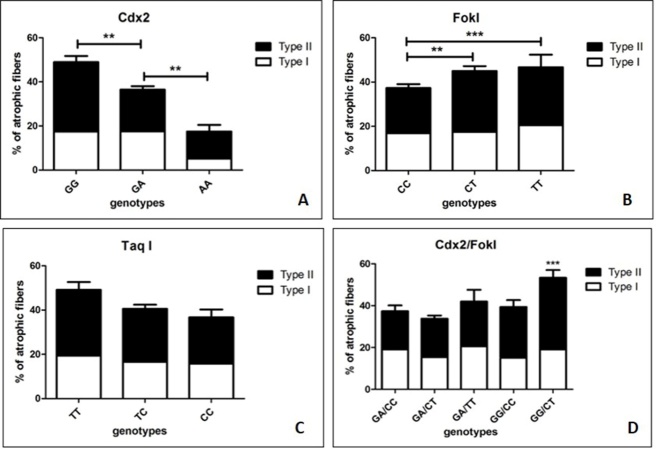
Figure 5.
Comparison between FokI, Cdx2 and TaqI polymorphisms and the percentage of positive myonuclei. (A) The comparison between Cdx2 genotypes and muscle atrophy displays a significant group effect (GG =50%; GA= 38%; AA=18%; p=0,0004). Mann-Whitney test shows significant higher percentage of muscle atrophy (Type I = 17% vs Type II = 33%) in patients with GG genotype respect to patients with GA genotype (Type I = 17% vs Type II = 19%) (p=0,0035) and in patients with GA (Type I = 17% vs Type II = 19%) respect to patients with AA (Type I = 5% vs Type II = 13%) genotypes (p=0.0004). (B) The comparison between genotypes of FokI polymorphisms and muscle atrophy (CC =38%; CT= 45%; TT=46%) did not show a significant group effect (p=0,1080). Mann-Whitney test shows significant higher percentage of muscle atrophy in patients with CT genotype (Type I = 17% vs Type II = 28%) compared to patients with CC genotype (Type I = 17% vs Type II = 20%) (p= 0,0440). (C) The comparison between genotypes of TaqI polymorphisms and muscle atrophy (TT=50%; TC= 40%; CC=37%) did not reveal a significant group effect (p=0,1282). (D) Patients with GG/CT and GG/CC genotypes showed a significant higher percentage of type II atrophic fibers (Type II =35% and 25% respectively) respect to other genotypes combination (Type I =18% and 15% respectively).

