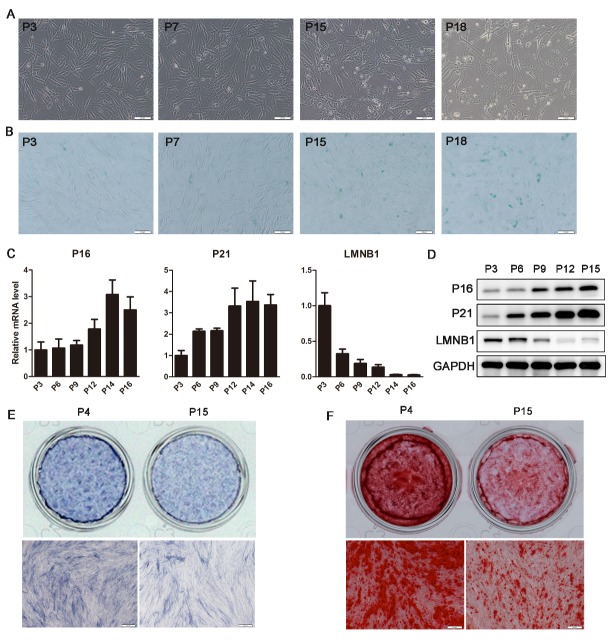
Figure 1.
Characterization of senescent hADSCs. (A) The morphology of hADSCs, as observed under the microscope at passage 3, 7, 15, and 18 (P3, 7, 15, and 18). (B) SA-β-gal staining (blue) of hADSCs at P3, 7, 15, and 18. (C) qRT-PCR demonstrating mRNA expression levels of P16, P21, and LMNB1 at different passages of hADSCs. (D) Western blot analysis of protein levels of P16, P21, and LMNB1 at different passages of hADSCs. (E) ALP staining was performed on day 4 using different hADSC passage numbers (P4 and P15). (F) Alizarin red staining was performed to indicate mineral deposition on day 15 of different hADSC passages (P4 and P15). GAPDH was used as an internal control for western blot analysis, whereas qRT-PCR data were normalized to PPIA; results are presented as the mean ± SD, n = 3. Scale bars: 100 μm (A and B) or 200 μm (E and F).

