
Figure 2.
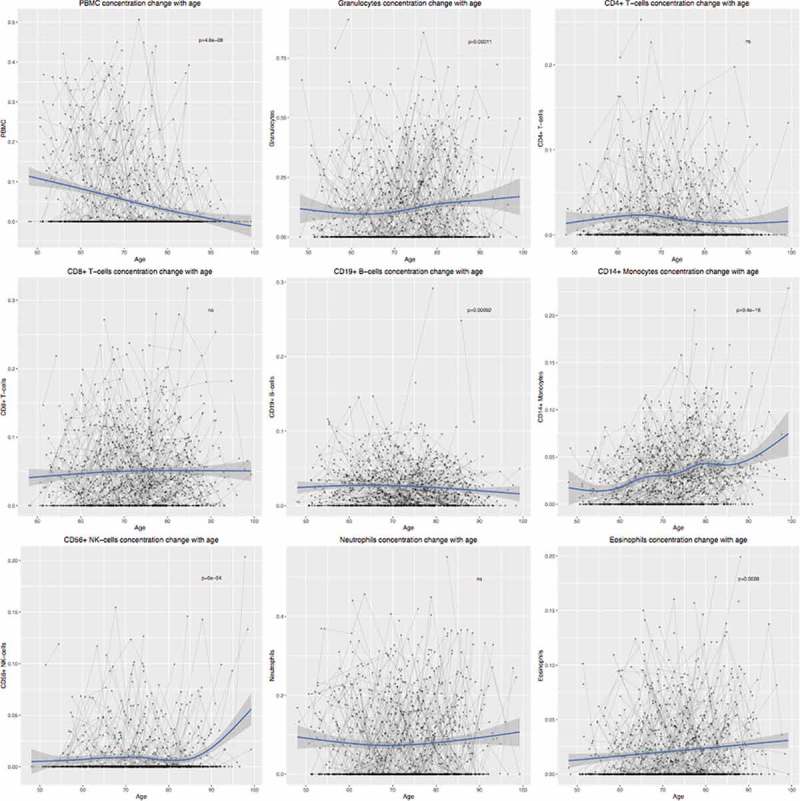
Longitudinal changes of cellular compositions with age. Estimated cellular compositions were plotted against age for each cell types. Grey lines indicate multiple observations of individuals. P-values were calculated from a mixed effect model measuring the longitudinal change of cellular proportions. PBMC, peripheral blood mononuclear cell; NK cell, natural killer cell.