Figure 1.

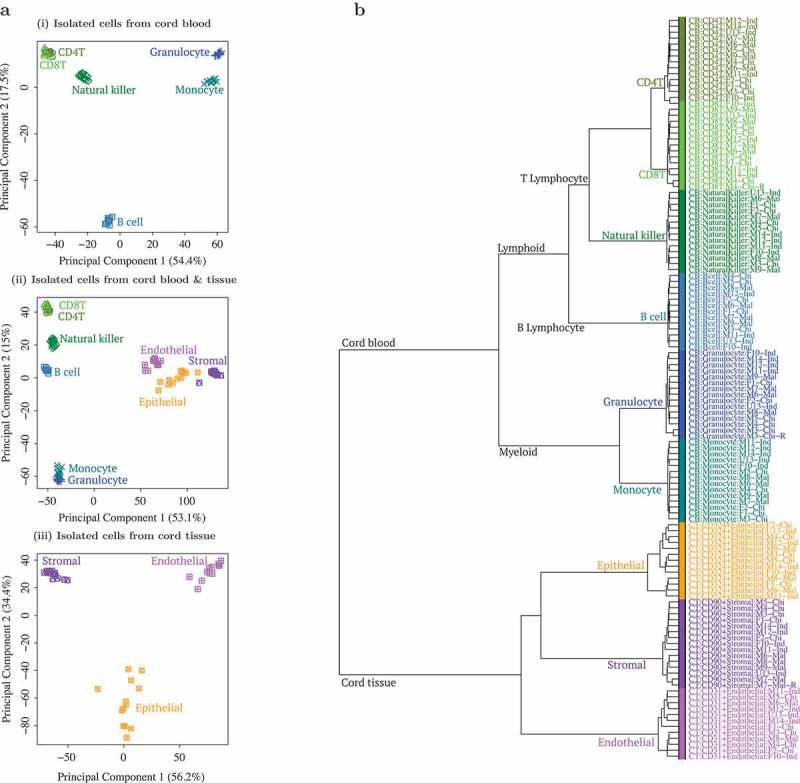
Principal component analysis (PCA) and hierarchical clustering showed clear distinction between cell types isolated from cord tissue (CT) and cord blood (CB).(a) First 2 principal components (PC) from PCA of genome-wide methylation profiles of (i) 6 cell type populations from CB, (ii) a combination of all 9 cell type populations and (iii) 3 cell type populations from CT. Three populations from CT are shown in purple/pink/orange and 6 populations from CB are shown in blue/green color tones. In (i) CB only PCA, first PC separated by myeloid vs. lymphoid hematopoietic stem cell linage (granulocyte/monocyte vs. B cell/CD4T/CD8T/natural killer (NK)), while the second PC separated B cells from the rest. In (ii) combined PCA, first PC separated by tissue (CB vs. CT) while second PC separated CB populations by myeloid vs. lymphoid hematopoietic stem cell linage (granulocyte/monocyte vs. B cell/CD4T/CD8T/NK). In (iii) CT only PCA, first PC separated the 3 distinct cell types (CD90+ stromal vs. CD324+ epithelial vs. CD31+ endothelial). (b) Dendrogram from hierarchical clustering of epigenome-wide DNA methylation profiles of 9 cell type populations isolated from CB and CT. Three populations from CT are shown in purple/pink/orange and 6 populations from CB are shown in blue/green. Cell type populations first clustered by tissue: CB vs. CT. CB populations further clustered by myeloid vs. lymphoid hematopoietic stem cell linage: granulocyte (Gran)/monocyte (Mono) vs. B cell/CD4T/CD8T/NK. CT populations further formed 3 distinct cell type clusters: CD90+ stromal vs. CD324+ epithelial vs. CD31+ endothelial.
