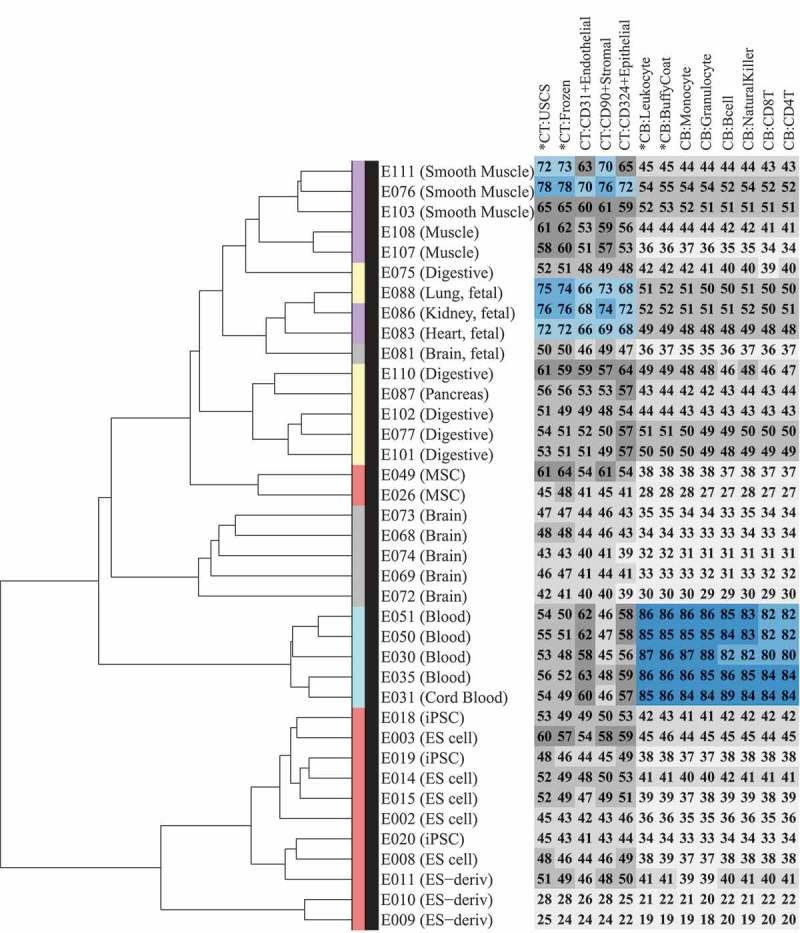
Figure 4.

Comparison of Epigenome Roadmap samples with unfractionated cord tissue (CT), cord blood (CB), and their constituent cell types.Heatmap (number and color) represents Spearman correlation between CT/CB samples in the current study and 38 samples profiled using reduced representation bisulfite sequencing (RRBS) under the Epigenome Roadmap project. Each column represents a distinct CT/CB cell or tissue-type. Each row represents a distinct cell/tissue sample from the Epigenome Roadmap project. Spearman correlation is represented on a 0–100 scale, and color in heatmap changes from grey to blue as correlation increases. Dendrogram shows hierarchical clustering of Epigenome Roadmap samples. Color in the dendrogram represents germinal origins of samples from the Epigenome Roadmap project. Primary tissues/cells of mesodermal (MSC-derived), mesodermal (HSC-derived), endodermal, and ectodermal germinal origins are represented in purple, turquoise, yellow and grey, respectively. Embryonic stem (ES) cell derived and primary culture samples are represented in red.
