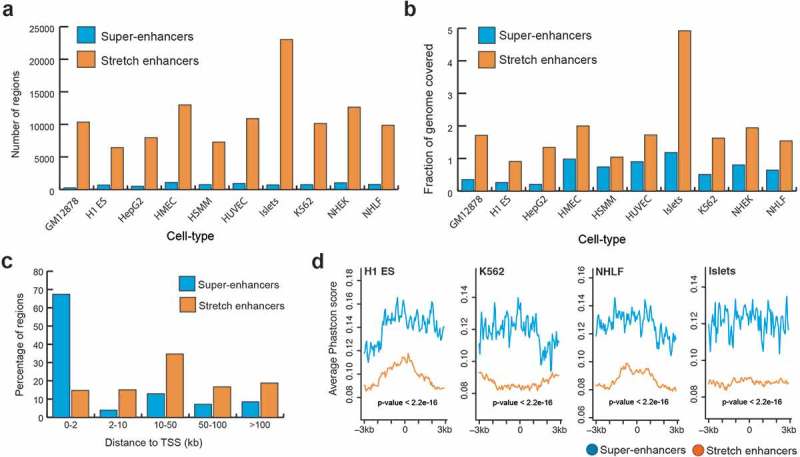
Figure 1.

Genomic distribution and conservation of super-enhancers and stretch enhancers in 10 human cell types.
(a) Number of super- and stretch enhancers in 10 cell types. (b) Fraction of the human genome covered by super- and stretch enhancers across 10 human cell types. (c) Distribution of distances to TSS for super- and stretch enhancers (average across the 10 cell types) (P value <2.2e-16, Wilcoxon rank sum test). (d) Evolutionary conservation score, phastCons scores obtained from UCSC 100 vertebrate species (phastCons100way) at super- and stretch enhancers with 6 kb flanking regions in H1-ES, K562, NHLF, and Islets cell types.
