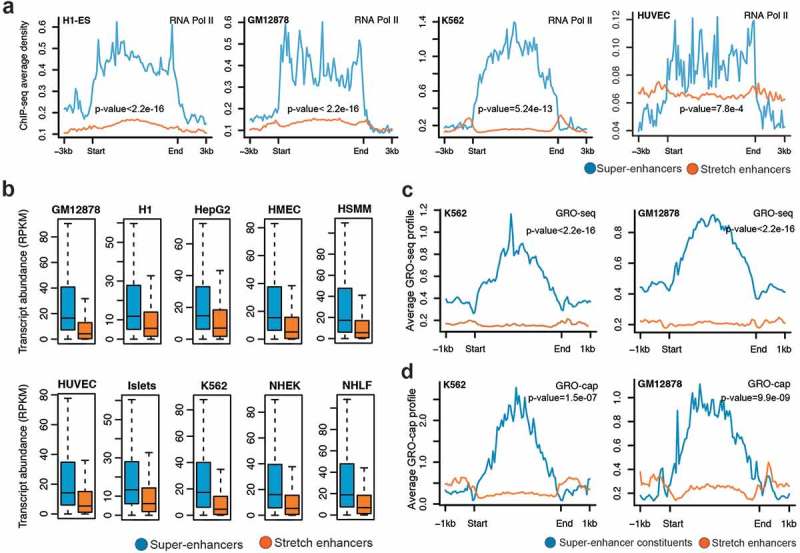
Figure 4.

Transcriptional activity at super-enhancers and stretch enhancers.
(a) Genome-wide profile of RNA Pol II at super- and stretch enhancers in H1-ESC, GM12878, K562, and HUVEC cell-lines. (b) Transcriptional abundance in reads per kilobase of transcript per million mapped reads (RPKM) of genes near (within a 50 kb window) super- and stretch enhancers across 10 cell types (P value <2.2e-16, Wilcoxon rank sum test). (c) GRO-seq profiles at the constituents of super- and stretch enhancers in K562 and GM12878 cell-lines. (d) GRO-cap profiles at the constituents of super- and stretch enhancers in K562 and GM12878 cell-lines.
