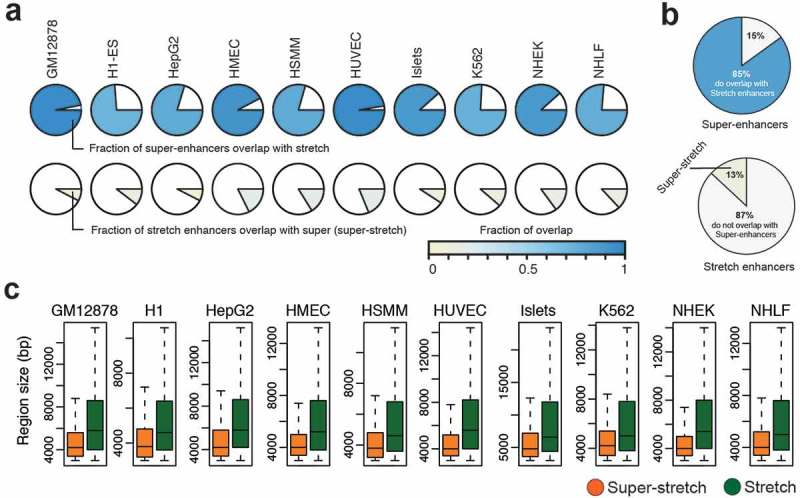
Figure 5.

Overlap analysis of super-enhancers and stretch enhancers.
(a) Fraction of overlap between super- and stretch enhancers across the ten cell types. (b) Pie chart of average overlap of super- and stretch enhancers. (c) The region length in base pairs (bp) of super-stretch and stretch enhancers across 10 cell types (p-value < 2.2e-16, Wilcoxon rank sum test).
