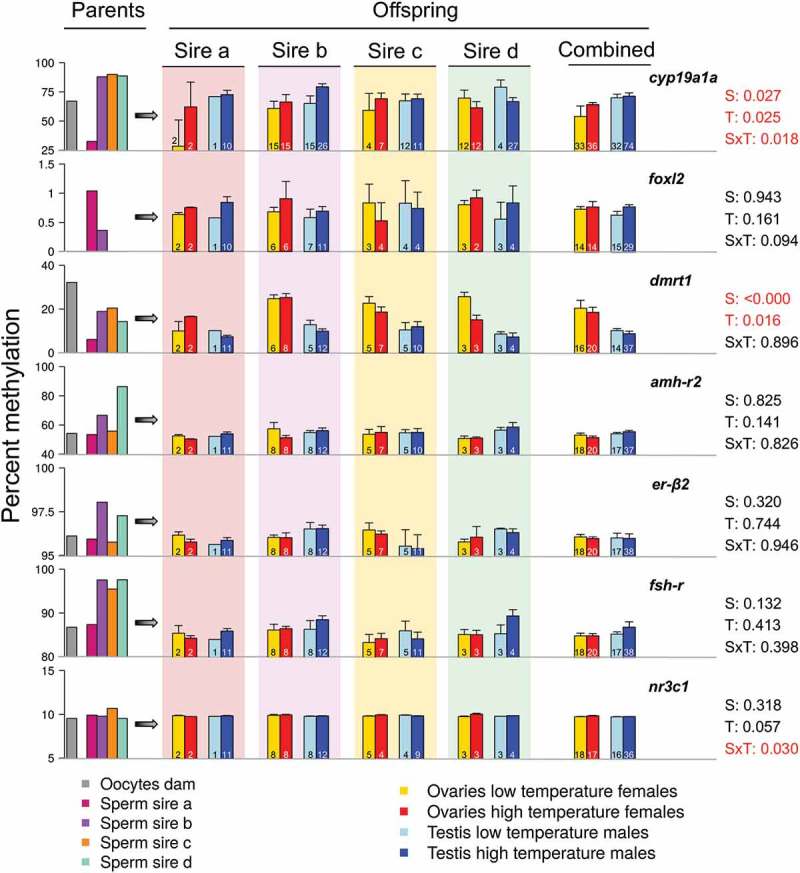
Figure 2.

DNA methylation levels of the genes examined in the parents and the offspring. In the left part of the figure, the DNA methylation in the oocytes of the dam (grey), the sperm of sire a (deep pink), b (violet), c (orange) and d (green blue) is shown. The central and right part of the figure illustrate the DNA methylation levels in the offspring, separately by each sire with the background color indicating the corresponding sire and also, in the offspring of the four sires combined. The offspring is divided in four groups according to sex and temperature experienced during early development and DNA methylation values are shown in the ovaries of low (yellow) and high (red) temperature females and in the testis of low (light blue) and high (blue) temperature males. The far-right data indicate p-values for the effects of sex (S), temperature (T) or their interaction (SxT). The absolute numbers of fish analyzed in each case are shown inside the bars. Data as mean ± SEM.
