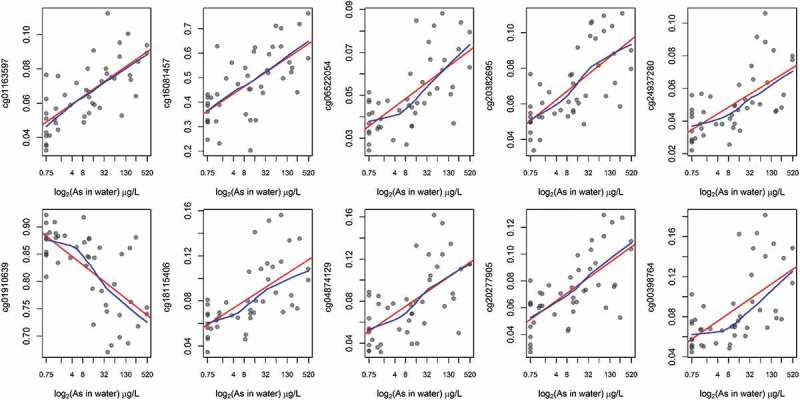
Figure 5.

Unadjusted associations between prenatal As exposure and CpG methylation among the top-ten CpGs associated with gestational age.
red: linear regression line; blue: locally weighted scatter plot smoothing

Unadjusted associations between prenatal As exposure and CpG methylation among the top-ten CpGs associated with gestational age.
red: linear regression line; blue: locally weighted scatter plot smoothing