
Figure 2:
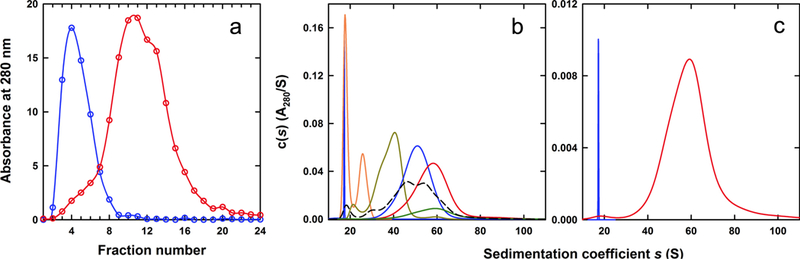
Fractionation and characterization of ferritin. (A) Monomeric Sigma-Aldrich ferritin was fractionated on a 5–30% (w/v) sucrose gradient. Absorbance profiles for apoferritin (blue) and ferritin (red) following centrifugation at 38,000 rpm for 2.5 hours on a SW40Ti rotor, and fractionation. Fraction 1 is the top of the gradient, whereas fraction 24 is the bottom. (B) Selected sedimentation velocity c(s) profiles for monomeric ferritin fractions resolved on a 5–30% sucrose gradient and purified by size exclusion chromatography. Profiles for fractions 5 (orange), 8 (dark yellow), 11(blue), 14 (red) and 17 (green) are shown, along with data for apoferritin (blue, scaled plot) and unfractionated monomeric ferritin (dashed black line). (C) Sedimentation velocity c(s) profiles for monomeric apoferritin (blue, scaled plot) and fractionated ferritin, fraction 17 corresponding to fully loaded ferritin (red). Fully loaded ferritin has a sedimentation coefficient of 60S.