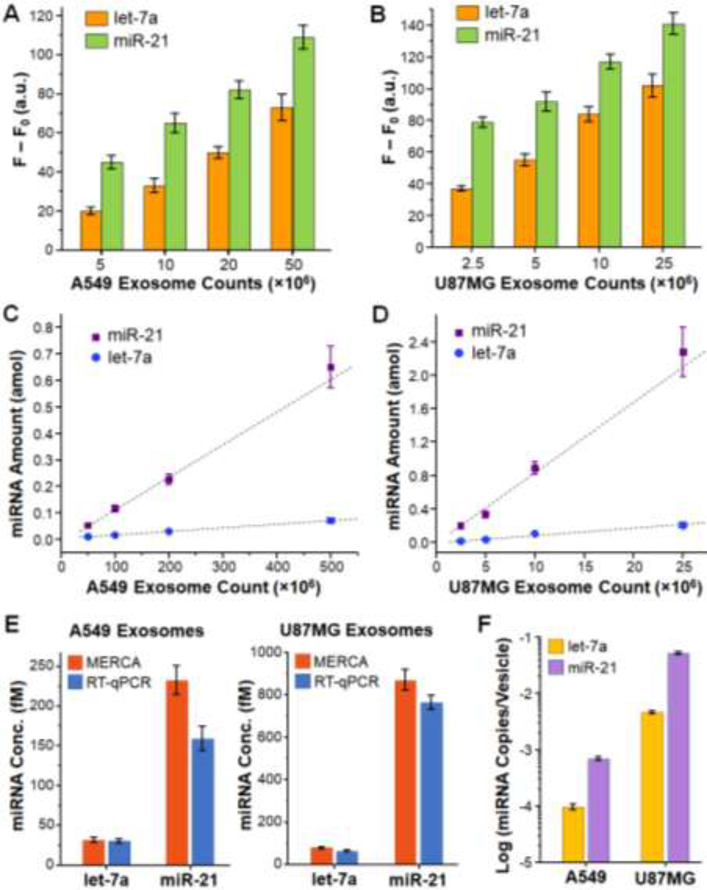
Figure 6. MERCA analysis of miRNAs in exosomes.
(A, B) Background-subtracted fluorescence readouts for the detection of let-7a and miR-21 in a serial dilution of exosome standards derived from A549 (A) and U87MG cells (B). The concentrations of A549 and U87MG exosome standards were 2 × 10¹¹ and 1 × 10¹⁰ vesicles/mL, respectively. Exosomes were lysed and then diluted by the TET buffer. 10 μL of each diluted sample was injected into the chip for analysis. Error bars are one standard deviation (n = 4). (C, D) Plots of the let-7a and miR-21 amount in A549 exosomes (C) and U87MG exosomes (D) calculated from the fluorescence readouts in (A, B) using the calibration curves in Figures 4 and 5, respectively. Error bars indicate standard error. (E) Bar graphs comparing the concentrations of let-7a and miR-21 in the original A549 and U87MG exosome standards measured by the MERCA and RT-qPCR. Error bars are one standard deviation (n ≥ 3). (F) Averaged miRNA copy number per exosome for let-7a and miR-21 in the A549 and U87MG exosomes, respectively, calculated from the MERCA results in (E).

