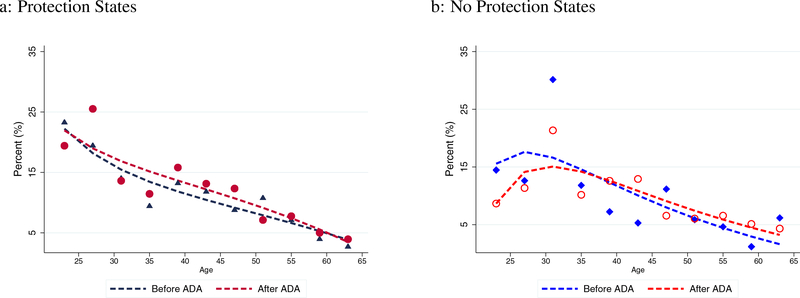
Figure 12: Life-Cycle Profile of Non-Employment-to-Employment by Group.
Note: Figures 12a and 12b illustrate the weighted average of employment-to-non-employment transition rates for states with and without preexisting employment protection, respectively. Blue and red markers in Figures 12a and 12b represent the data before and after the ADA. Dashed lines are fitted values of these data points in quadratic age.

