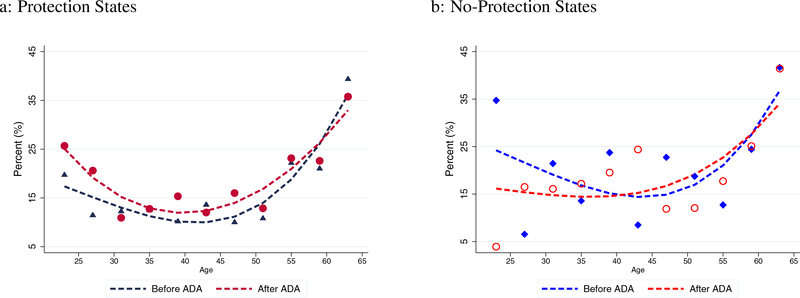
Figure 6: Life-Cycle Profile of Employment-to-Non-Employment Transition by Age Group.
Note: Figures 6a and 6b illustrate the weighted average of employment-to-non-employment transition rates for states with and without pre-existing employment protection, respectively. Triangle (diamond) and circle markers represent the data before and after the ADA, respectively. Dashed lines are fitted values of these data points in quadratic age.

