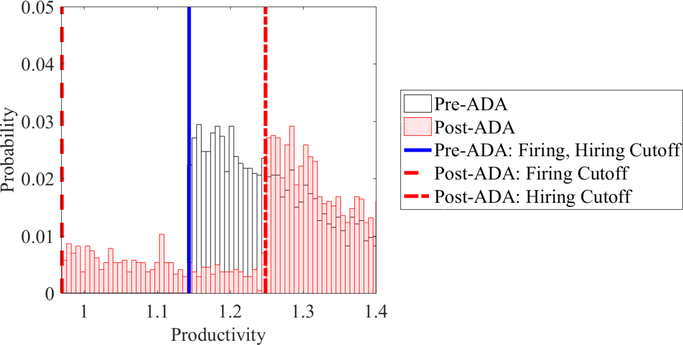
Figure 7: Productivity Distribution Pre- and Post-ADA.
Note: Figure 7 shows the simulated productivity distribution of disabled workers (truncated to the right to focus on marginal workers) pre- and post-ADA. The reservation productivities for firing and hiring are the same in the benchmark economy, but due to heterogenous costs, they diverge post-ADA: firing standards are relaxed, while hiring standards become more strict.

