
Figure 1: PP2A function is essential for B cell survival.
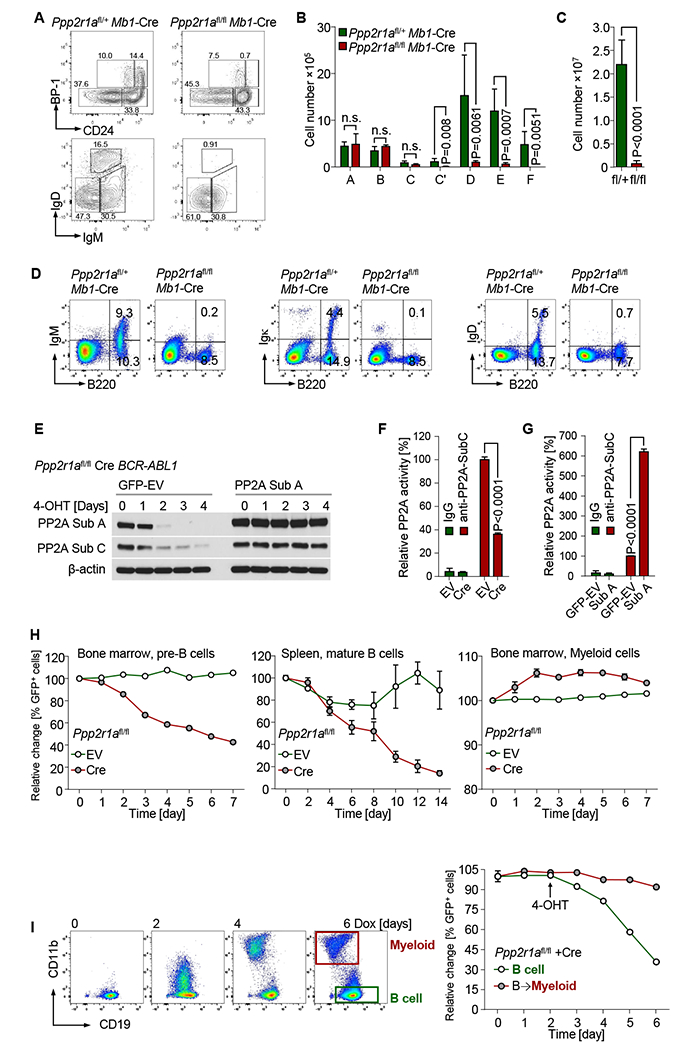
(A) B cell development in Ppp2r1afl/fl Mb 1-Cre mice was examined by flow cytometry. Hardy fractions of B cell subsets isolated from bone marrow were analyzed. Absolute cell numbers were calculated for B cell subsets from bone marrow (B) and spleen (C). Surface staining of BCR components was performed by flow cytometry (D). Ppp2r1afl/fl BCR-ABL1 ALL cells were transduced with 4-hydroxy-tamoxifen (4-OHT)-inducible Cre-ERT2 (Cre) or ERT2-vector (EV). Cells were subsequently transduced with PP2A-subA-IRES-GFP (PP2A Sub A) or GFP-Vector (GFP-EV). (E) PP2A expression in Cre-transduced cells after 4-OHT treatment was measured by Western blot. PP2A Thr/Ser phosphatase activity was measured in Cre- or EV-transduced cells after 3 days of 4-OHT treatment (F). Cre-GFP+ Cre cells transduced with Sub A or GFP-EV were sorted for PP2A-activity measurement after 3-days 4-OHT treatment (G). Bone marrow pre-B cells, splenic B cells and myeloid leukemia cells from Ppp2r1afl/fl mice were transduced with Cre or EV (H). Percentages of GFP+ cells were determined by flow cytometry at time points indicated following 4-OHT treatment. (I) Ppp2r1afl/fl BCR-ABL1 B-ALL cells were transduced with doxycycline (Dox)-inducible C/EBPα (TetOn-Cebpa) and subsequently transduced with Cre. Percentages of GFP+ cells in B-lymphoid (CD19+ CD11b−) and B→myeloid (CD19− CD11b+ ) populations were measured by flow cytometry at time points indicated following Dox (4-OHT treatment started at time point indicated by arrow). Data are shown as mean ± standard deviation (SD) and representative of at least three independent experiments.