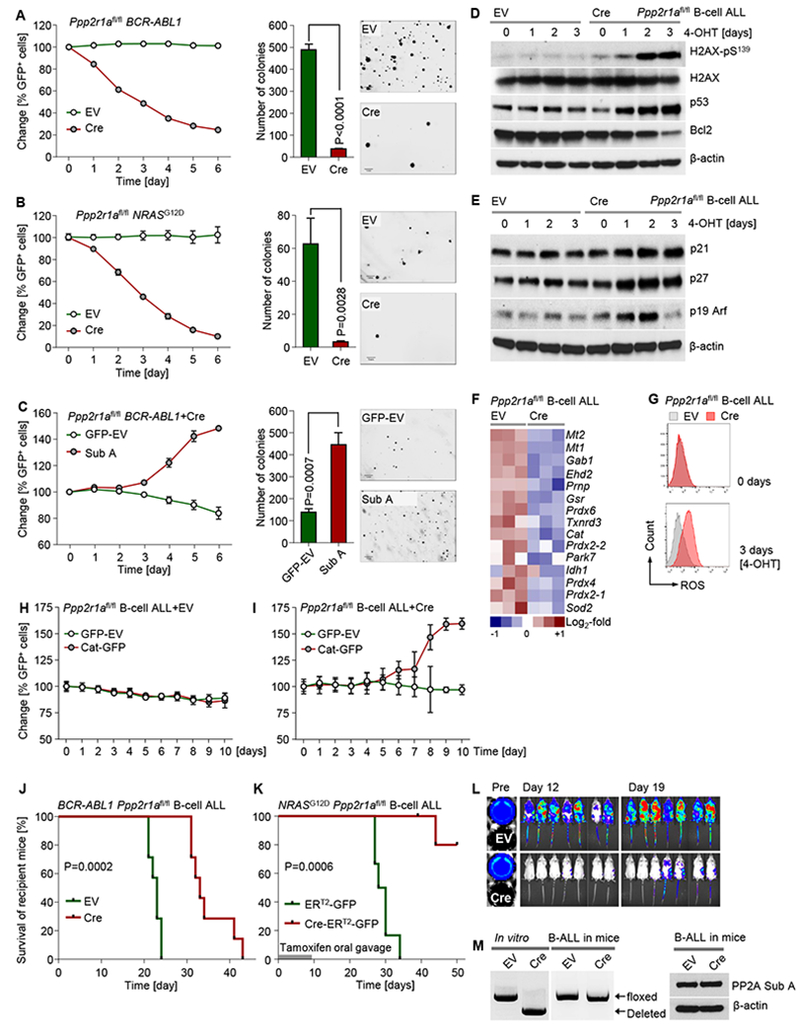
Figure 2: PP2A is required for the survival of BCR-ABL1 and NRASG12D ALL cells.

Ppp2r1afl/fl BCR-ABL1 (A) and NRASG12D B-ALL (B) cells were transduced with Cre-ERT2-IRES-GFP (Cre) or ERT2-IRES-GFP-vector control (EV). Percentages of GFP+ cells were measured following 4-OHT treatment. Cre or EV-transduced ALL cells were treated for 3 days with 4-OHT and plated in methylcellulose to perform colony formation assays. Photomicrographs of colonies were taken for colony counting (scale bar indicating 1 mm). (C) The fractions of GFP+ BCR-ABL1 B-ALL cells transduced with Sub A or GFP-EV were measured following 4-OHT treatment. GFP+-sorted cells transduced with Sub A or GFP-EV were studied by colony formation assay. Ppp2r1afl/fl BCR-ABL1 B-ALL cells transduced with Cre or EV were treated with 4-OHT. (D) Western blot to measure phosphorylation of H2AX and expression of p53, Bcl2 (D) and p21, p27 and p19 Arf (E) was performed after 4-OHT treatment. (F) A heatmap to depict gene expression changes of antioxidant genes (microarray data; GSE83742) of Ppp2r1afl/fl B-ALL cells after 3-days 4-OHT treatment (Cre-mediated deletion) is shown. (G) ROS levels were measured by flow cytometry as DCF-fluorescence. Ppp2r1afl/fl BCR-ABL1 ALL cells transduced with EV (H) or Cre (I) were transduced with Catalase-IRES-GFP (Cat-GFP) or GFP-vector (EV). Percentages of GFP+ cells were measured following 4-OHT treatment. (J) Ppp2r1afl/fl BCR-ABL1 ALL cells were labeled with firefly luciferase and transduced with Cre or EV. 2 days after transduction, GFP+ cells were injected intravenously into recipient NSG mice (1×10⁶ cells/mouse; 7 mice in each group). B-ALL cell burden was monitored by luciferase bioimaging (L). Ppp2r1afl/fl NRASG12D B-ALL cells were transduced with inducible Cre or EV, sorted for GFP+ cells and injected intravenously into recipient NSG mice (3×10⁶ cells/mouse; 6 mice in each group) followed by 7 days of tamoxifen treatment via oral gavage to induce deletion in vivo (K). In (J-K), Kaplan-Meier estimates were used to plot the survival probabilities for mice that were transplanted with Cre- and EV-transduced cells. Log-rank test was used to assess statistical significance. In experiment (J), mice that showed signs of illness from leukemia were sacrificed to collect splenic B-ALL cells. GFP+ cells from recipient mice were used for PCR and Western blot to determine Ppp2r1a genotype and PP2A expression, respectively (M). Except survival analyses, other experimental data are shown as mean ± standard deviation (SD) and representative of at least three independent experiments.
