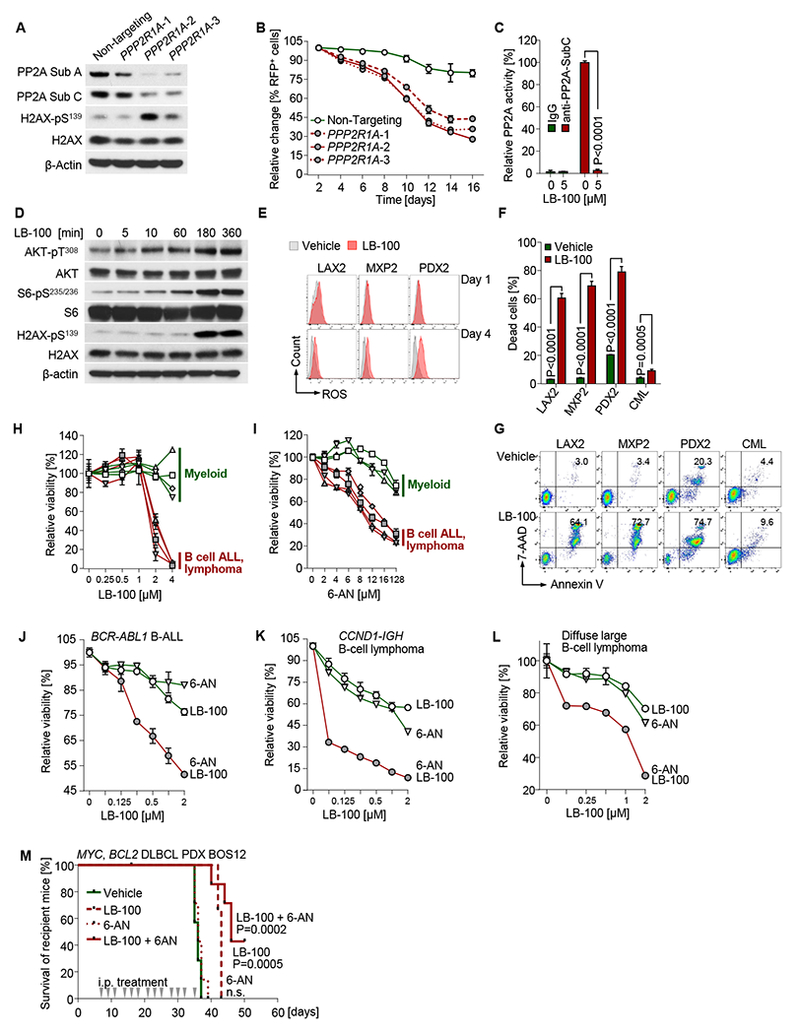
Figure 7: Target validation of PP2A and the PPP in human B cell malignancies.

(A) Patient-derived Ph+ ALL xenograft (PDX2) cells were used for doxycycline (Dox)-inducible CRISPR-Cas9 mediated gene disruption of PPP2R1A (3 different gRNAs were used). Western blot was performed to measure expression of PP2A and phosphorylation of H2AX after 3 days of Dox-treatment. (B) Percentages of targeted cells were measured following Dox-treatment. (C) Patient-derived Ph+ ALL xenograft (LAX2) cells were treated with the PP2A inhibitor LB-100 (5 μmol/l) for 12 hours. Cell lysates were assayed for PP2A Thr/Ser phosphatase activity assay. (D) The same cells were cultured with 2 μmol/L LB-100 and harvested at time points indicated. Western blot was performed to measure phosphorylation of AKT, S6 and H2AX. (E) Intracellular ROS levels were measured in patient-derived Ph+ ALL xenografts cells on days 1 and 4 of treatment with LB-100 (2 μmol/L). (F) Cell viability measurements of human B-lymphoid Ph+ ALL (LAX2, MXP2, PDX2) and myeloid leukemia cells (JURL-MK1) cells after 4-days of treatment with 2 μmol/L LB-100 are plotted. Representative flow cytometry plots are shown (G). (H-I) Relative cell viabilities were measured after treatment of LB-100 (H) or 6-AN (I) for 72 hours with gradients of concentrations as indicated in B-lineage Ph+ ALL (LAX2, MXP2, PDX2 and BLQ5; n=4) and myeloid leukemia (KYO-1, EM-2, JURL-MK1 and MV4-11; n=4) cells. Y-axis shows percentages of viable cells relative to vehicle-treated cells (set to 100%). (J) Patient-derived Ph+ ALL (PDX2) cells, (K) mantle cell lymphoma cells (SP-53) and (L) diffuse large B-cell lymphoma cells (OCI-Ly10) were treated with LB-100, 6-AN or a combination of both compounds for 72 hours. Relative cell viability was assessed to measure synergistic effect of combination treatment. (M) Patient-derived diffuse large B cell lymphoma cells (BOS12) were intravenously injected to recipient NSG mice (3×10⁶ cells/mouse; 7 mice in each group). Intraperitoneal injection of LB-100 (1.5 mg/kg), 6-AN (1 mg/kg) or combination (1.5 mg/kg LB-100 + 1 mg/kg 6-AN) started 7 days after cell injection at indicated time points. Kaplan-Meier survival curves are shown. Log-rank test was used to assess statistical significance of each treated group compared to vehicle group. Except for Kaplan-Meier survival analyses, other experimental data are shown as mean ± standard deviation (SD) and representative of at least three independent experiments.
