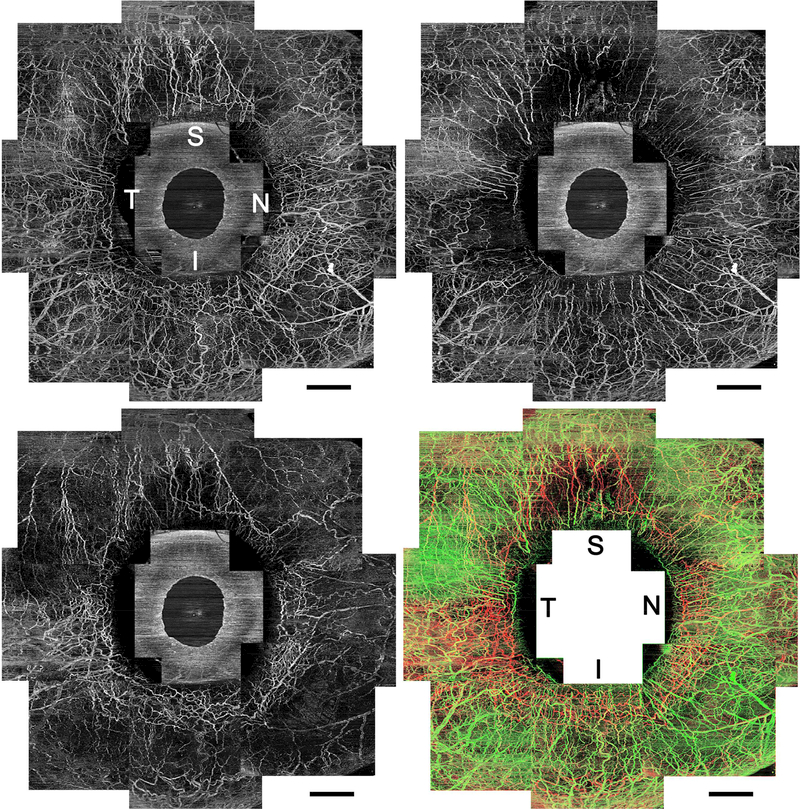
FIGURE 2.
Circumferential vasculature panoramic images acquired using optical coherence tomography angiography (OCTA) of the right eye in a healthy participant. (Top left) An OCTA en face image with whole OCTA signals. (Top right) A superficial-layer flow image with en face maximum projection from the conjunctival epithelium to a depth of 200 μm. Vessels distribute homogeneously from the limbus to the periphery. (Bottom left) A deep-layer flow image with en face maximum projection from a depth of 200 μm to 1000 μm from the conjunctival epithelium. Deep or mid scleral venous plexuses are densely arranged around the limbus, and fewer vessels extend to the periphery, which shows Y-shaped sectoral patterns. (Bottom right) Merged vasculature image shown in different colors (superficial layer network, green; deep layer, red; merged, yellow). It should be noted that the green and red vessels are separately visualized. I = inferior; N = nasal; S = superior; T = temporal. Scale bar = 2 mm.

