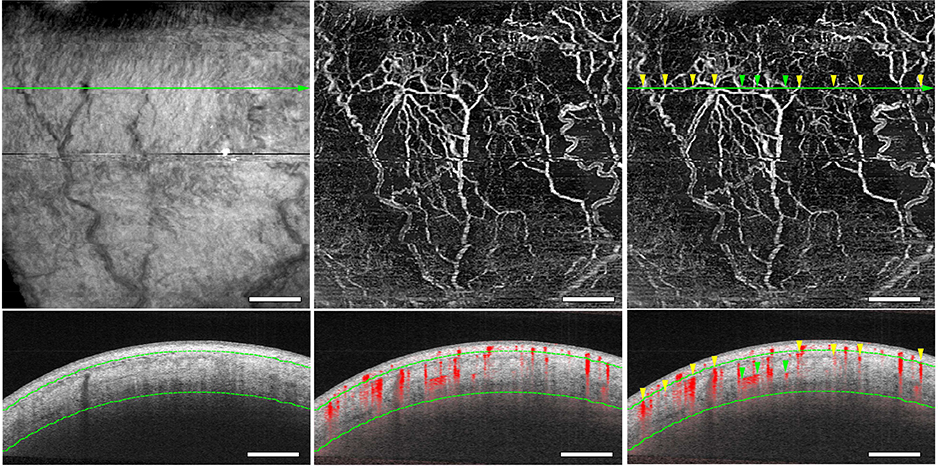
FIGURE 4.
Optical coherence tomography (OCT) luminal structures and OCT angiography (OCTA) flow signals. Deep-layer OCT (Top left) and OCTA (Top middle and Top right) en face flow images in the inferior quadrant. (Bottom row) A B-scan image (Bottom left) and a cross-sectional angiography image overlying the B-scan image (Bottom middle and Top right) acquired at the green line in Top row. Luminal structures are identical in OCT images, and OCTA signals correspond to the episcleral and intrascleral luminal structures (yellow and green arrowheads, respectively). Green dotted lines are determined as a depth of 200 μm and 1000 μm from the conjunctival epithelium. Scale bar = 1 mm.

