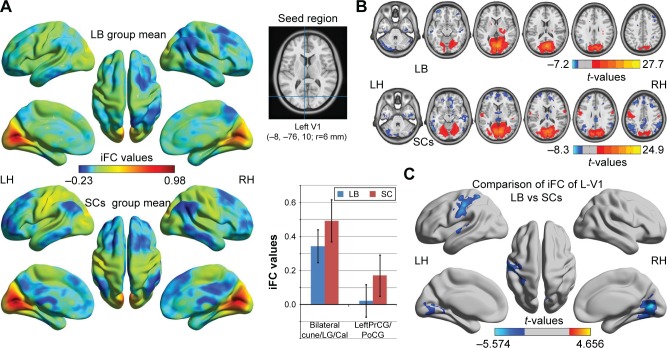
Figure 1.
Significant zFC maps of left V1 differences between two groups.
Notes: (A) Distribution mean zFC pattern of left V1 in group-level of LB and SC subjects in the typical frequency band (0.01–0.1 Hz). (B) Intragroup patterns of zFC maps of left V1 between two groups. (C) Significant zFC maps of left V1 differences between two groups (voxel-level: P<0.01, GRF correction, cluster-level: P<0.05).
Abbreviations: GRF, Gaussian random field; iFC, intrinsic functional connectivity; LB, late blindness; LH, left hemisphere; RH, right hemisphere; SCs, sighted controls; V1, primary visual cortex; zFC, z-values functional connectivity.

