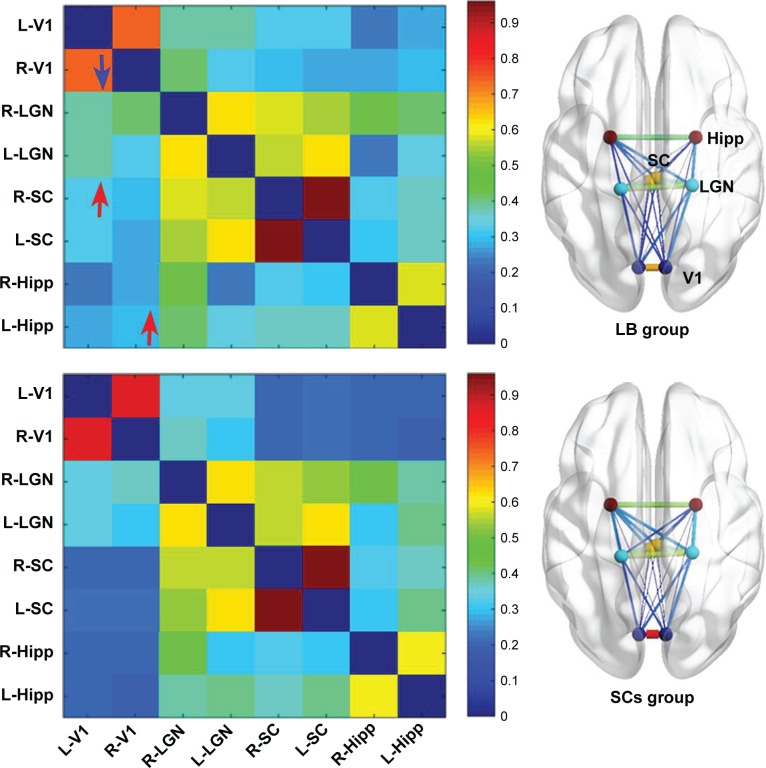
Figure 3.
Significant zFC maps of V1 and vision-related nuclei differences between two groups.
Notes: Visualization for abnormal rs-FC within V1 and vision-related nuclei between two groups (voxel-level: P<0.01, GRF correction, cluster-level: P<0.05). Red arrows denote increased FC; blue arrows denote decreased FC.
Abbreviations: FC, functional connectivity; GRF, Gaussian random field; Hipp, hippocampus; L, left; LB, late blindness; LGN, lateral geniculate nucleus; R, right; SCs, sighted controls; SC, superior colliculus; V1, primary visual cortex.

