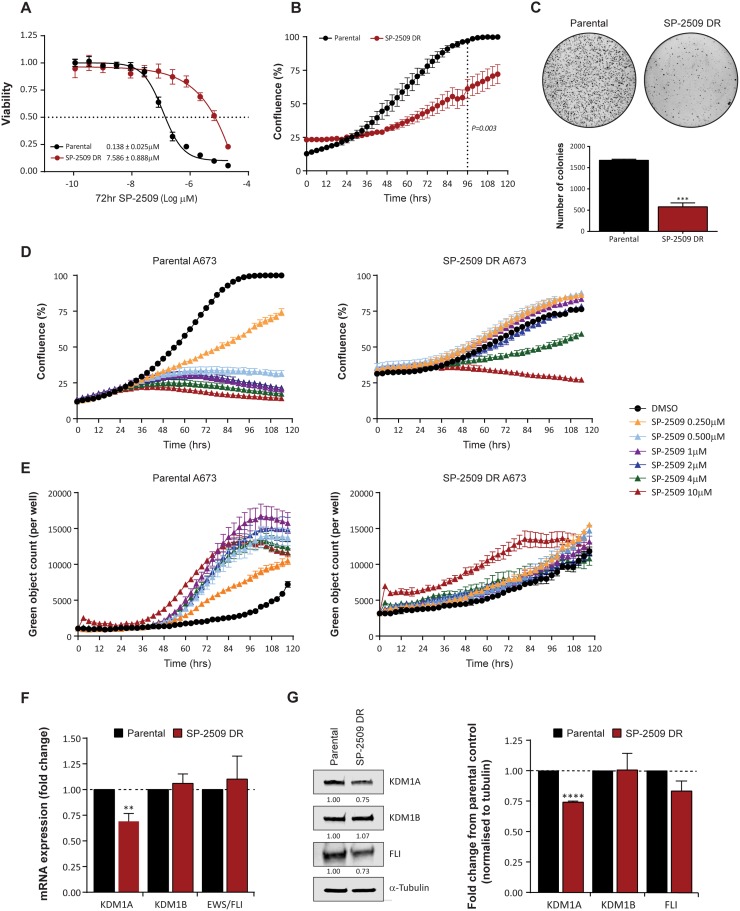
Figure 1. SP-2509 drug resistant A673 cells display reduced proliferative and anchorage independent growth.
(A) Sensitivity of parental and SP-2509 drug resistant (DR) A673 cells to SP-2509. Cell viability assessed through CellTiter Glo analysis, 72 hrs after treatment. (B) 120 hr IncuCyte proliferative growth analysis of parental and SP-2509 DR A673 cells. (C) Anchorage independent growth of parental and SP-2509 DR A673 cells determined through soft agar assays. Quantification of the average number of colonies per plate is also depicted. IncuCyte proliferative growth (D) and Caspase 3/7 induction (E) of parental and SP-2509 DR A673 cells treated with the indicated concentrations of SP-2509 or vehicle control (DMSO) for 120 hrs. Basal mRNA (F) and (G) protein levels of KDM1A, KDM1B and EWS/FLI from parental and SP-2509 DR A673 cells. All data represents mean ± SEM from three independent experiments. Asterisks denote statistical significance **P < 0.01, ***P,0.001, ****P < 0.0001.

