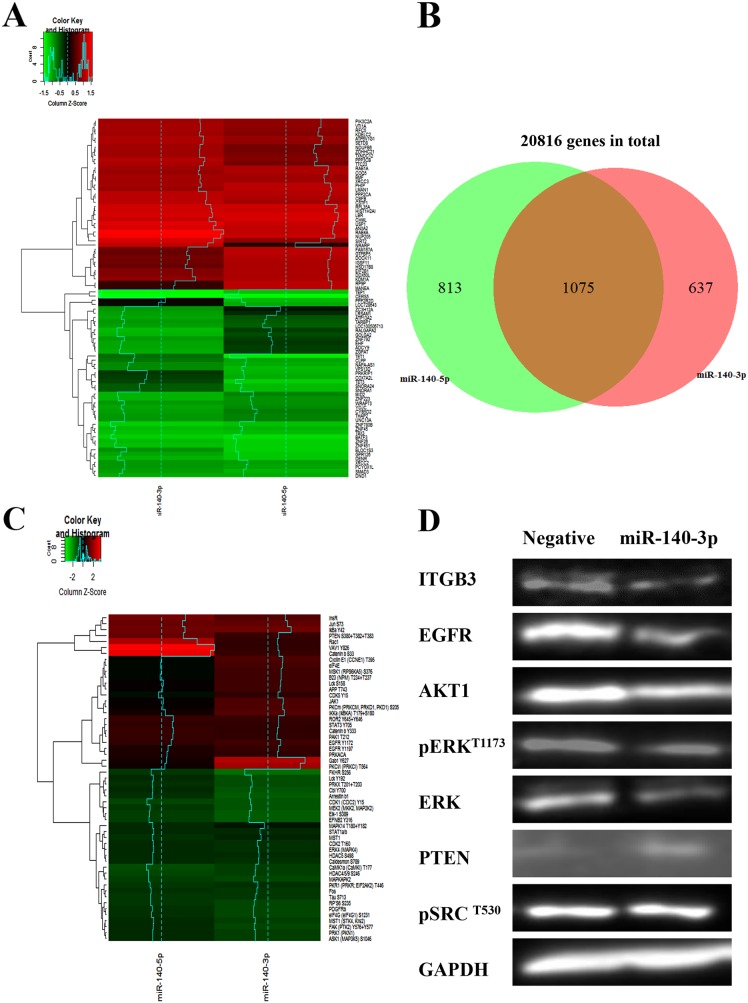
Figure 6. Distinctive gene regulation profiles and cell signalling pathways induced by two strands of miR-140.
(A) Heatmap of the RNA-seq data showing the altered upregulated (red) and downregulated (green) genes in A549 treated with miR-140-3p and miR-140-5p, respectively. Global transcriptome analysis of 20816 gene targets was performed using the Ion AmpliSeq™ human gene expression panel. (B) The Venn diagram showing the differential gene expression induced by miR-140-3p and miR-140-5p, respectively, based on the RNA-Seq data. (C) Heatmap of the Kinex antibody array data showing the distinctive cell signalling pathways altered by the two strands of miR-140. The values of Z-score reflected positive or negative shifts in differential protein expression fold-changes after normalization by protein concentration and negative miRNA mimics. (D) Evaluation the expression of some key downstream effectors of miR-140-3p in A549 cells after treatments for 48 hours by Western blotting.

