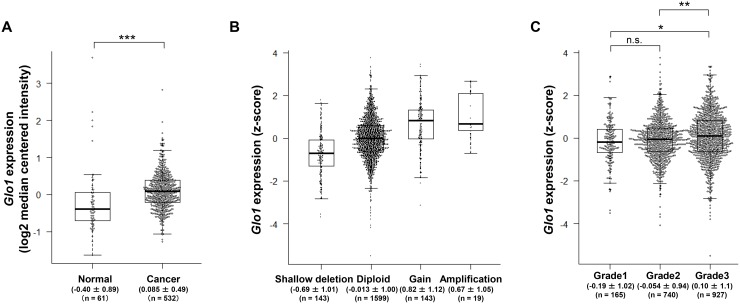
Figure 1. Glo1 is overexpressed in grade 3 breast cancer tumors despite a low frequency of gene copy number alternation and genetic mutation.
(A) Box plot comparing Glo1 expression in normal (n = 61) and cancer tissue (n = 532) (from the TCGA dataset). Values indicate the medians ± SD. ***p < 0.001; Mann-Whitney U test. (B) Effect of copy number status on Glo1 expression: shallow deletion (n = 143), diploid (n = 1599), gain (n = 143), and amplification (n = 19) (from the METABRIC dataset). Values indicate the medians ± SD. (C) Glo1 expression in grade 1 (n = 165), grade 2 (n = 740), and grade 3 (n = 927) tumors (from the METABRIC dataset). Values indicate the medians ± SD. *p < 0.05, **p < 0.01, n.s. = not significant; Kruskal-Wallis test with Steel-Dwass test. Center line, median; box limits, upper and lower quartiles; whiskers, ± 1.5 × IQR; points, all data points.

