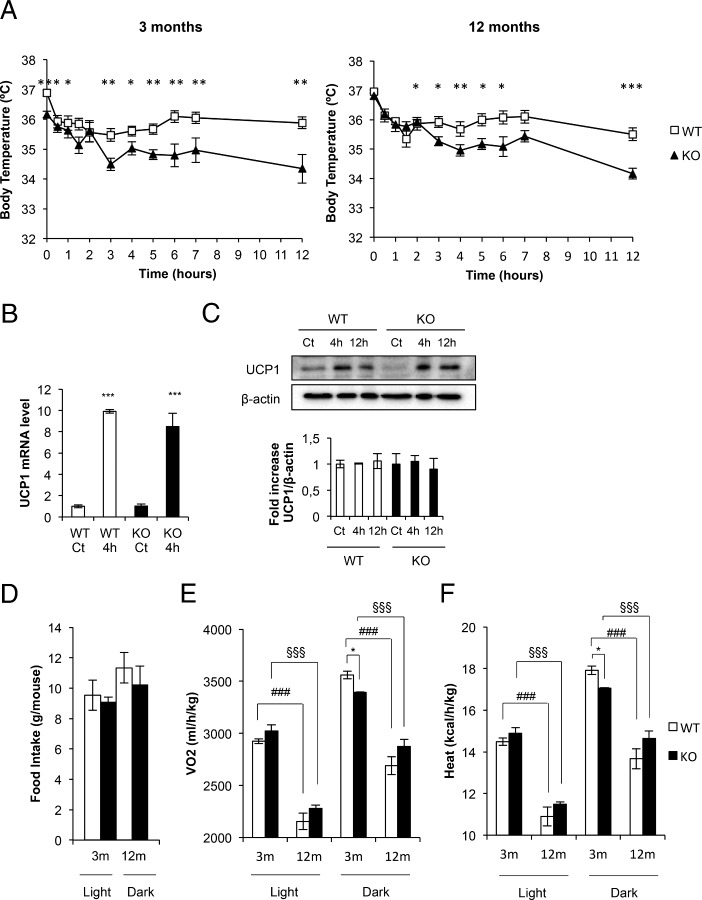
Figure 4.
Cold acclimation and energy expenditure in BATIGFIRKO and (WT) mice. A, Representative plots of cold-exposure analysis showing the temperature from 0 to 12 h comparing Igf1r L/L (n = 8 at 3 mo and n = 5 at 12 mo) and BATIGFIRKO (n = 6 at 3 mo and n = 11 at 12 mo) mice at 3 mo (left plot) and 12 mo (right plot). B, Ucp-1 mRNA levels detected by q-PCR after 4 h of cold-exposure comparing 3-month-old Igf1r L/L (n = 4) and BATIGFIRKO (n = 4) mice. C, Comparison of UCP-1 protein levels at 4 and 12 h of cold exposure and its corresponding quantitation comparing 3-month-old Igf1r L/L (n = 4) and BATIGFIRKO (n = 4) mice. Statistical significance assessed by two-tailed Student t test. *, P < .05; **, P < .01; ***, P < .001 between WT and KO groups at 3 and 12 mo. D, Daily food intake under standard diet; E,VO2; and F, heat production were measured comparing Igf1r L/L (n = 4 at 3 mo and n = 4 at 12 mo) and BATIGFIRKO (n = 4 at 3 mo and n = 4 at 12 mo) mice. Mice were housed individually and all measurements were taken every 10 minutes during 72 h. Statistical significance assessed by one-way ANOVA followed by the Bonferroni test. *, P < .05; **, P < .01; ***, P < .001 between WT and KO groups at 3 and 12 mo; #, P < .05; ##, P < .01; ###, P < .001 between WT groups; and §, P < .05; §§, P < .01; §§§, P < .001 between KO groups, respectively.

