Figure 5.
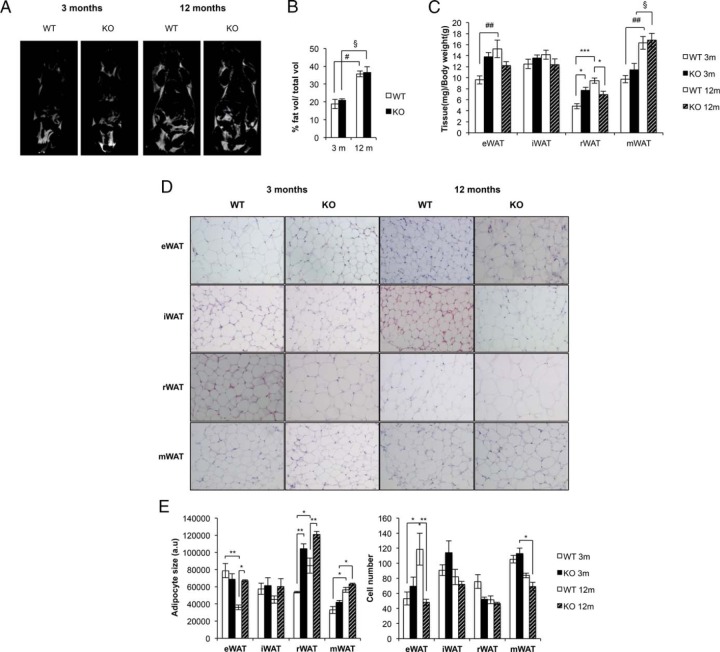
The adipose organ in BATIGFIRKO mice. A, Representative images from NMR comparing Igf1r L/L and BATIGFIRKO mice at 3 and 12 mo. B, Graph representing the percentage of fat volume per total volume at 3 and 12 mo in Igf1r L/L (n = 4 at 3 mo and n = 4 at 12 mo) and BATIGFIRKO (n = 4 at 3 mo and n = 4 at 12 mo) mice. C, Graph representing the eWAT, iWAT, rWAT and mWAT weights per total body weight comparing Igf1r L/L (n = 12) and BATIGFIRKO (n = 13) mice at 3 and 12 mo, respectively. D, Adipocyte size from eWAT, iWAT, rWAT, and mWAT compartments are shown comparing Igf1r L/L (n = 5) and BATIGFIRKO (n = 5) mice from 3 and 12 mo (n = 250 adipocytes per group) at magnification, ×20. The corresponding quantitation is presented below. E, Adipocyte number quantification from eWAT, iWAT, rWAT, and mWAT compartments comparing Igf1r L/L (n = 5) and BATIGFIRKO (n = 5) mice at 3 and 12 mo, respectively. Statistical significance assessed by one-way ANOVA followed by the Bonferroni test. *, P < .05; **, P < .01; ***, P < .001 between WT and KO groups at 3 and 12 mo; #, P < .05; ##, P < .01; ###, P < .001 between WT groups; and §, P < .05; §§, P < .01; §§§, P < .001 between KO groups, respectively.

