
Figure 4. Cell viability and induction of ARE-luciferase activity by FX treatment in HepG2-C8 cells transfected with the ARE-luciferase vector.
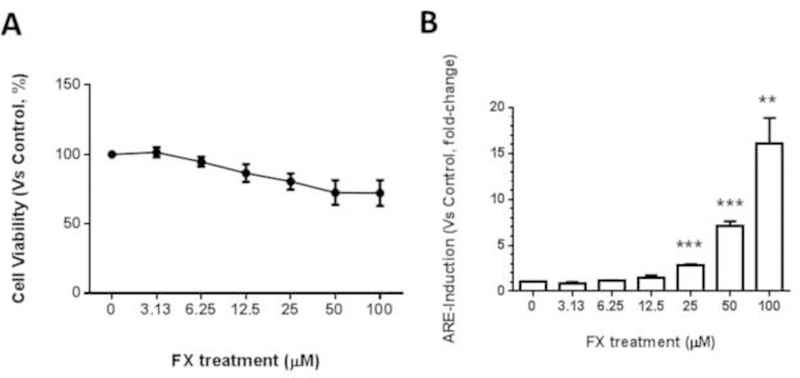
(A) Cell viability of the JB6 P+ cells after treatment with FX. Cells were treated with various concentrations of FX ranging from 3.13 µM to 100 µM for one day. Cell viability was determined by the MTS assay. The data are presented as the means ± SEM. (B) The luciferase activity was normalized based on the protein concentrations in the BCA protein assay. The data are presented as the means ± SEM of three independent experiments. **, P < 0.01 and ***, P < 0.001 indicate significant differences between the treatment groups and the control group (DMSO 0.1% without FX). Student’s t-test was used to calculate the significance of the differences compared with the control.