
Figure 9. Effects of FX and AST on the activities of DNMTs and HDACs.
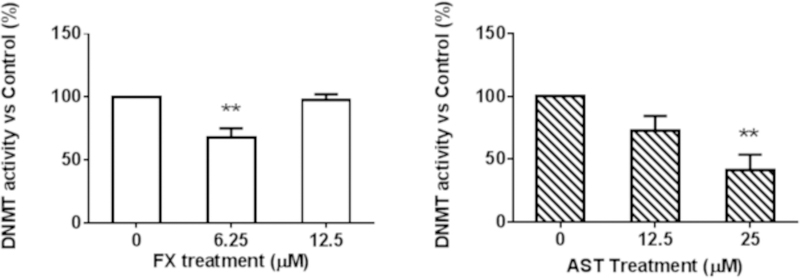
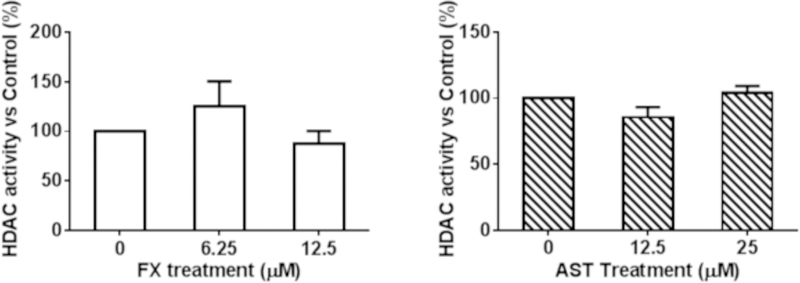
JB6 P+ cells were treated with various concentrations of FX and AST for three days. The relative DNMT and HDAC activities were normalized to the protein amount of each group and were calculated based on the ratio of the FX and AST treatment groups to the control group following the manufacturer’s protocol. The results of (A) DNMT activity and (B) HDAC activity are presented as the means ± SEM. Student’s t-test was used to calculate the significance of the differences compared with the control. **, P < 0.01.