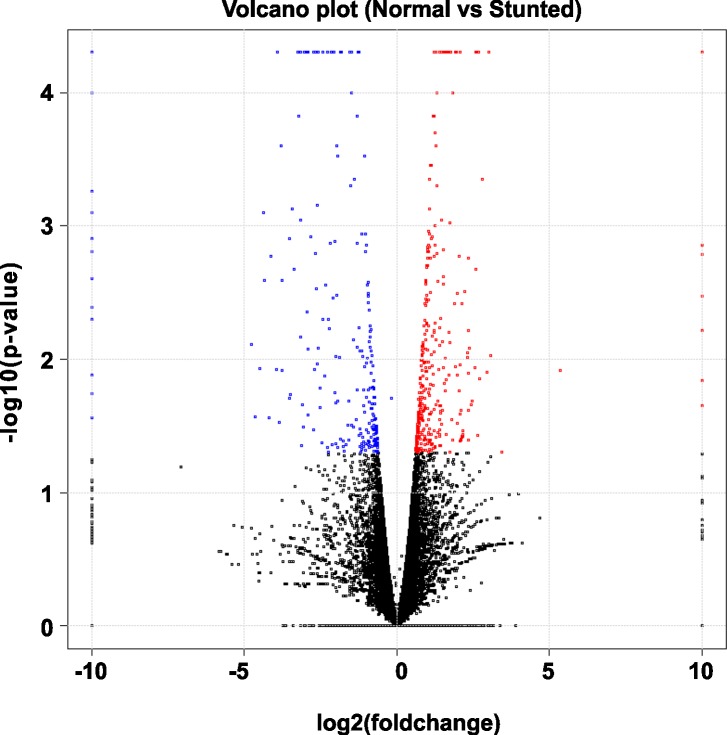
Fig 4. Volcano plot of differentially expressed genes (DEGs) between normal (N) and stunted (S) cherry tomato cv. ‘Minichal’.
X-axis and y-axis represent log2 fold-change differences between the compared samples and statistical significance as the negative log of DEG P-values, respectively. The significantly up-regulated and down-regulated genes are indicated with red and blue dots, respectively, while non-significant genes are shown as black dots.

