. 2018 Nov 27;7:e38407. doi: 10.7554/eLife.38407

Figure 5. The number of complex folds in a growing organoid depends on the generation time and the pressure from the surrounding medium (Figure 5—video 1).

(A) Number of local minima as a function of 1/(generation time), tG−1. In silico organoids grow from 200 cells up to 8000, 12,000, or 16,000 cells with different generation times and no outer pressure. (B) Number of local minima as a function of pressure, P. In silico organoids grow to the same size with the same 1/(generation time), tG−1 = 1.4⋅10−4 but different outer pressure. The images illustrate the 16,000 cells stage. Blue dots mark the average, while light shaded regions show the SEM based on triplicates. See also Figure 5—figure supplement 1 for additional measurements on the differences between rapid growth and pressure.

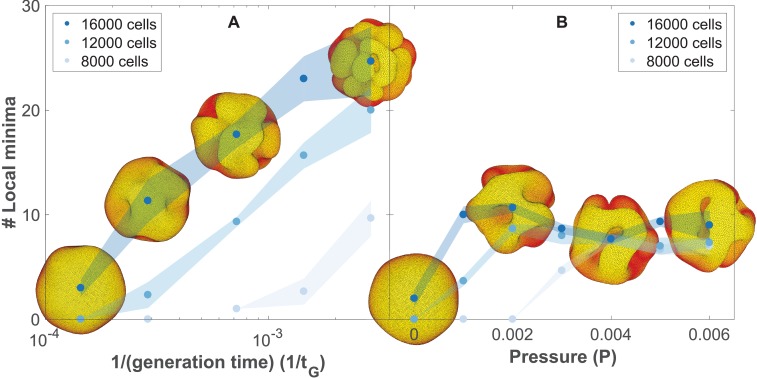
Figure 5.

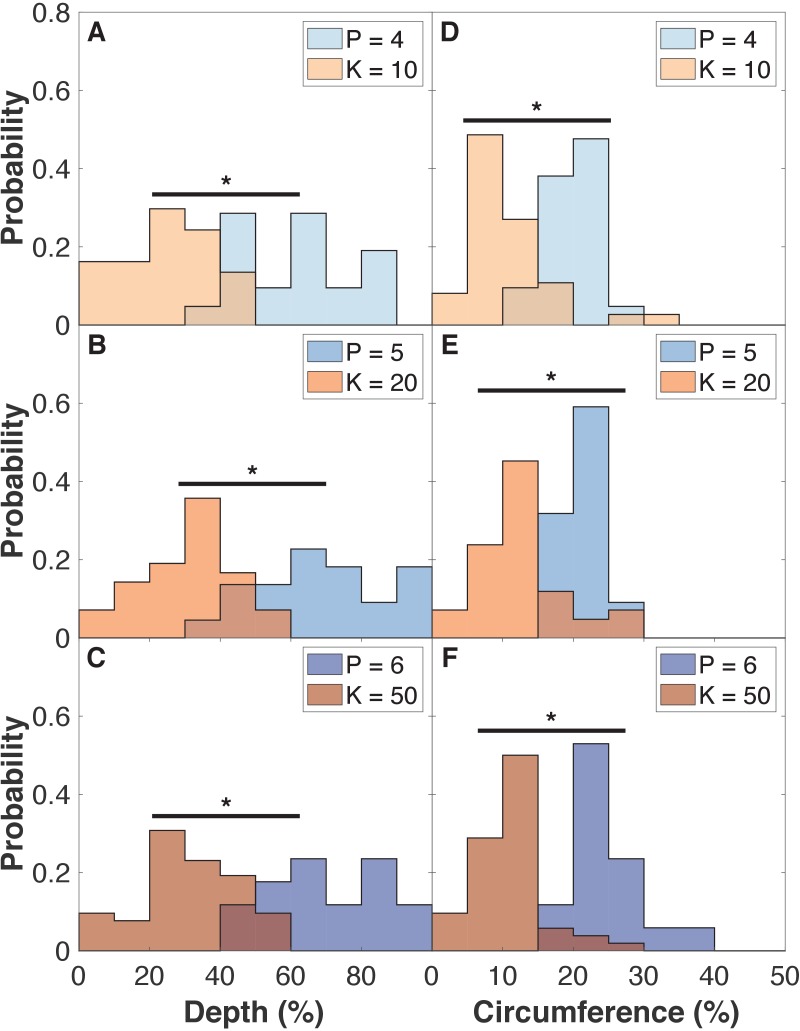
Figure 5—figure supplement 1. Organoids grown under external pressure have deeper and longer folds compared to organoids grown with rapid cell proliferation.

Figure 5—figure supplement 1.

To quantify the folds, we fill the surface of the organoids with 'water' until halfway between the maximum and minimum radius of the system. Then we measure the relative depth and circumference of these ‘lakes’. (A–C) Deepest point of the ‘lakes’ (folds) relative to the water level. The probability of having a lake at a given depth is normalized to the number of ‘lakes’. (D–F) Length of the ‘lakes’ relative to the entire circumference at this same level. Length of a lake is defined from the angle between the two cells at lake shore that are the furthest away from each other. Pressure and 1/(generation time) increase from upper to lower panels. Two-sample Kolmogorov-Smirnov tests showed p < 0.001 statistical significance (marked by *). The shown histograms are for the 16,000 cell stage, which compares to the dark blue line in Figure 5.
Figure 5—video 1. In silico organoids grown from 200 up to 16,000 cells.
Download video file (5.7MB, mp4)
DOI: 10.7554/eLife.38407.018
(A) Increasingly many near-surface folds emerge when the organoid is grown with rapid cell proliferation (tG−1 = 7⋅10−3, p = 0, Figure 5A). (B) Number of deep folds saturates when the organoid is grown slowly under resistance from matrigel (tG−1 = 1.4⋅10−4, p = 0.006, Figure 5B). Videos at the top illustrate the entire system, while the those at the bottom shows a cross-section of the system. Throughout, all organoid simulations in Figure 5 including the ones shown in this video, η = 10−4 and dt is the minimum of 0.2 and one fifth of the time to the next consecutive division in the system.