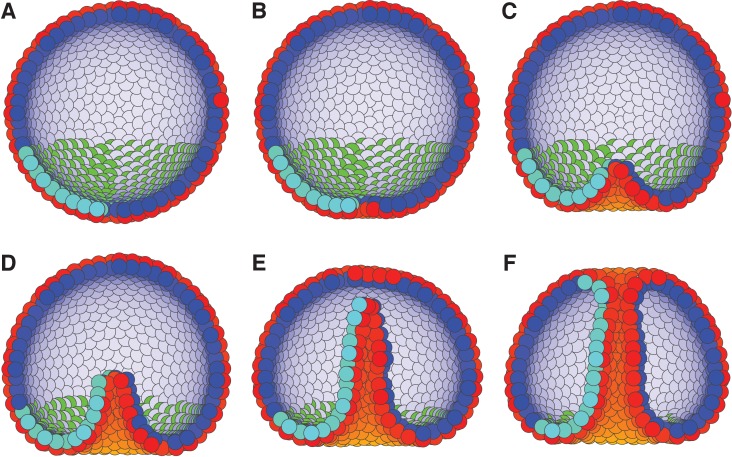
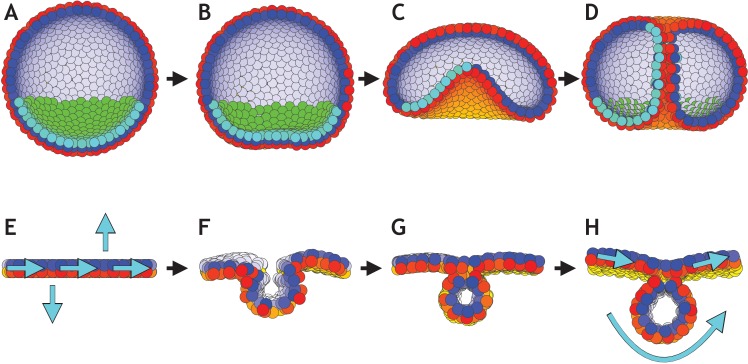
(
A–D) Gastrulation in sea urchin modeled without the apical constriction in
Figure 7. (
A) The lower third of the cells in the blastula acquire PCP (cyan–green) pointing opposite to the apical-basal (AB) polarity (red–yellow). (
B) Flattening of the blastula and invagination occur if direction of PCP is maintained for some time. During this initial phase λ
2 = 0.1, and there is no convergent extension (λ
3 = 0). (
C) In the final phase, we increase λ
2 to 0.4 and turn on λ
3 = 0.1. With this, we let PCP relax so it curls around the bottom, and allow it to change dynamically in time. (
D) As a result, tube narrows and elongates, until it finally connects and merges with the top. (
E–H) Initial conditions on PCP enable neural plate bending and neural tube closure. (
E) Starting with 1000 cells on a plane with AB polarity, we induce PCP along the plane together with two rows where the PCP points parallel and antiparallel to AB polarity (shown with cyan arrows). Here, we simulate the neural plate (cells in the middle, between the two rows with constrained PCP) surrounded by the epidermis (the rest of the cells). The two rows of cells with PCP pointing out of epithelial plane correspond to the cells at the dorsolateral hinge points next to the neural plate (epidermis boundaries). In chick, spinal neural tube can close with only these two hinge points (
Nikolopoulou et al., 2017). The bending is driven by apical constriction and PCP is essential for bending, convergent extension and closure. (
F) This enables neural plate bending and formation of the neural groove. (
G) Continuing the simulation leads to contact of the two sides of the neural plate and hereby neural tube closure. (
H) Finally, the system stabilizes with the neural plate on top of the neural tube. Comparing the initial stage to the final stage, the overall direction of PCP in the plate is conserved while in the tube PCP goes around an internal axis. For this simulation, we set λ
2 = 0.5 and λ
3 = 0. Turning on convergent extension (λ
3) at the final stage will allow for elongating the system along the axis going through the tube and narrowing it in another direction. The concept is similar to gastrulation in
Drosophila. In both simulations, sea urchin and neurulation, dt = 0.3. In sea urchin (A–D), the noise parameter
η = 3.3⋅10
−5, and in neurulation (E–H),
η = 3.3⋅10
−2.


