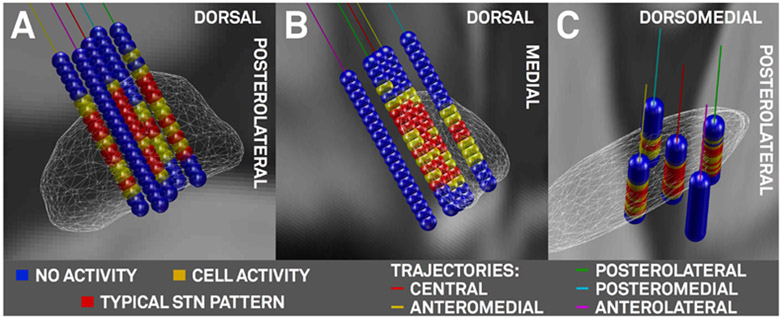
Figure 7:
Left-Hemispheric microelectrode recording results of the 3T example patient. A) oblique view orthogonal to the lateral surface of the STN (white wireframes). B) view from posterior and C) dorsal. Markers in blue (no cell activity), yellow (cell activity), red (typical STN firing pattern) placed on 45° rotated Ben Gun (X-) array of microelectrodes between 7.5 and −1.5 mm distance to surgical target in 0.5 mm steps. Trajectories: central (red), lateral (magenta), medial (cyan), posterior (green) and anterior (yellow) trajectories.

