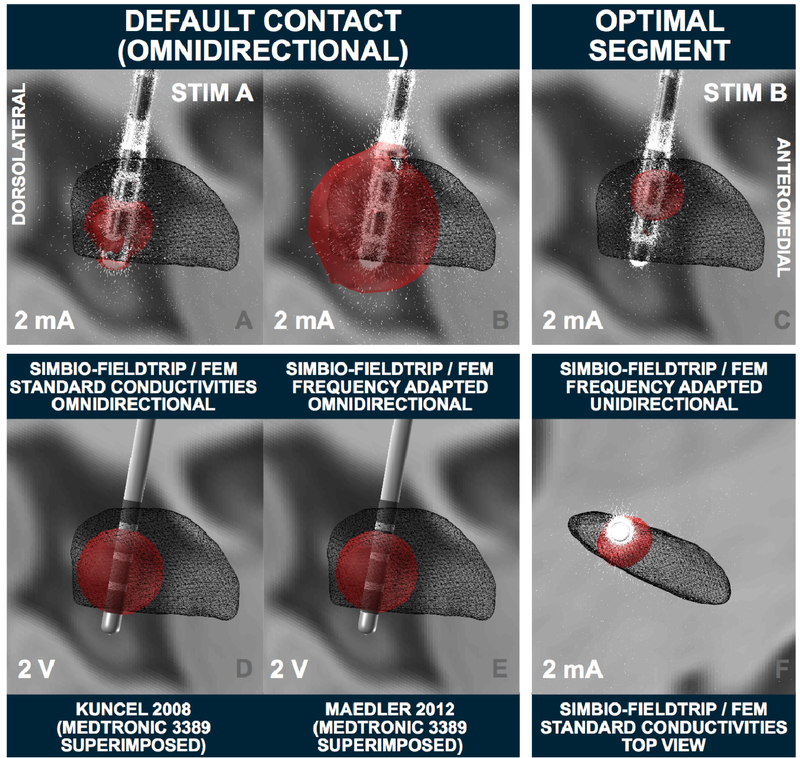
Figure 8:
VTA modeling (right hemispheric lead) in the 3T example patient. Left two columns: several omnidirectional stimulations at the default contact. Top row demonstrates the strong impact on standard conductivities vs. frequency-adapted conductivities in the resulting FEM-based VTA. Bottom row shows two heuristic voltage driven models implemented in Lead-DBS. These models are not validated for directional leads, thus, a Medtronic 3389 electrode is visualized instead. Right column: The “optimal” segment on the top (K13) is used as cathode, steering the field anterolaterally to reach a good coverage of the dorsolateral STN. Simulations marked with Stim A and B are used as connectivity seeds in subsequent figures.

