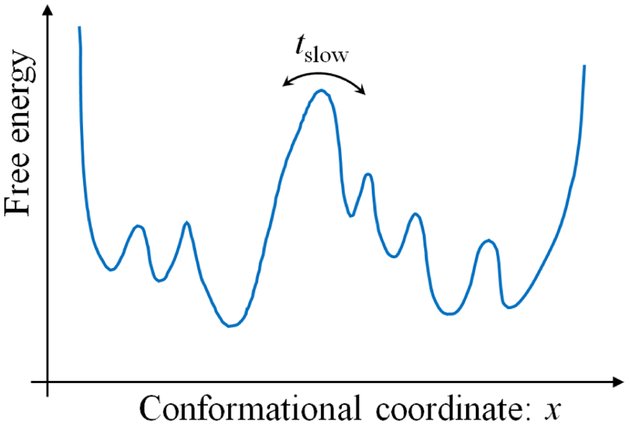
Figure 1.
Schematic illustration of a free energy landscape dominated by a slow process. The timescales associated with a system will often reflect “activated” (energy-climbing) processes, although they could also indicate diffusion times for traversing a rough landscape with many small barriers. In the figure, the largest barrier is associated with the slowest timescale tslow, and the danger for conventional MD simulations is that the total length of the simulation may be inadequate to generate the barrier crossing.

