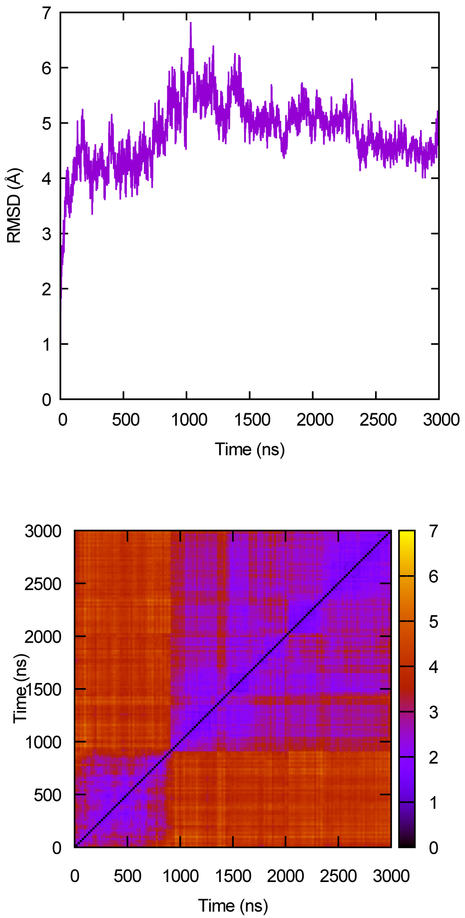
Figure 2.
RMSD as a measure of convergence. The upper panel shows the α-carbon RMSD of the protein rhodopsin from its starting structure as a function of time. The lower panel shows the all-to-all RMSD map computed from the same trajectory. Color scale is the RMSD, in Å. Data from Ref. [21].

