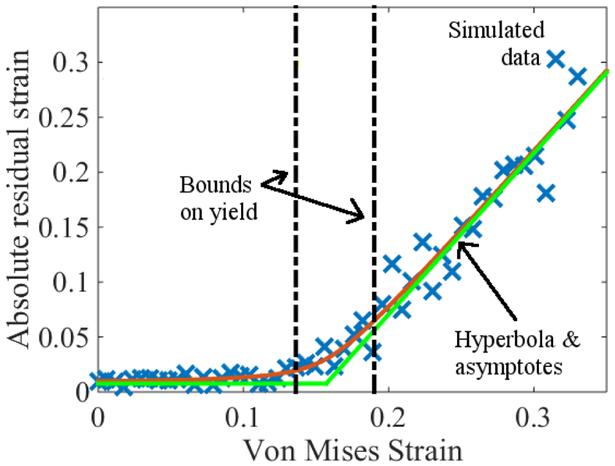
Figure 3.
Residual strain ϵr as a function of applied strain ϵ. Blue × denote simulated data, whereas the smooth curve is a hyperbola fit to the data. The green lines are asymptotes; their intersection can be taken as an estimate of ϵy. Bounds on yield are computed by the synthetic data method discussed in Sec. 7.6. From, “Estimation and uncertainty quantification of yield via strain recovery simulations,” P. Patrone, CAMX 2016 Conference Proceedings. Reprinted courtesy of the National Institute of Standards and Technology, U.S. Department of Commerce. Not copyrightable in the United States.

