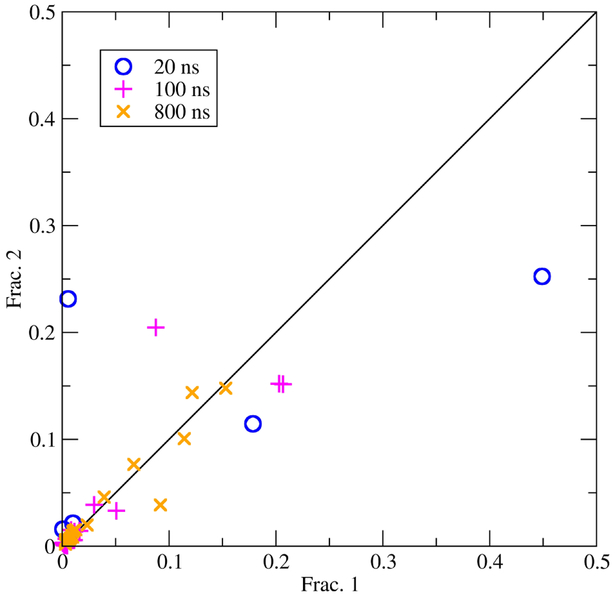
Figure 4.
Combined clustering between two independent trajectories as a measure of convergence. The X axis is the population of a cluster from trajectory 1, while the Y axis is the population of that cluster from trajectory 2. Cluster populations are show after 20, 100, and 800 ns of sampling. The simulations used to generate the data used in this plot are described in Ref. [25].

