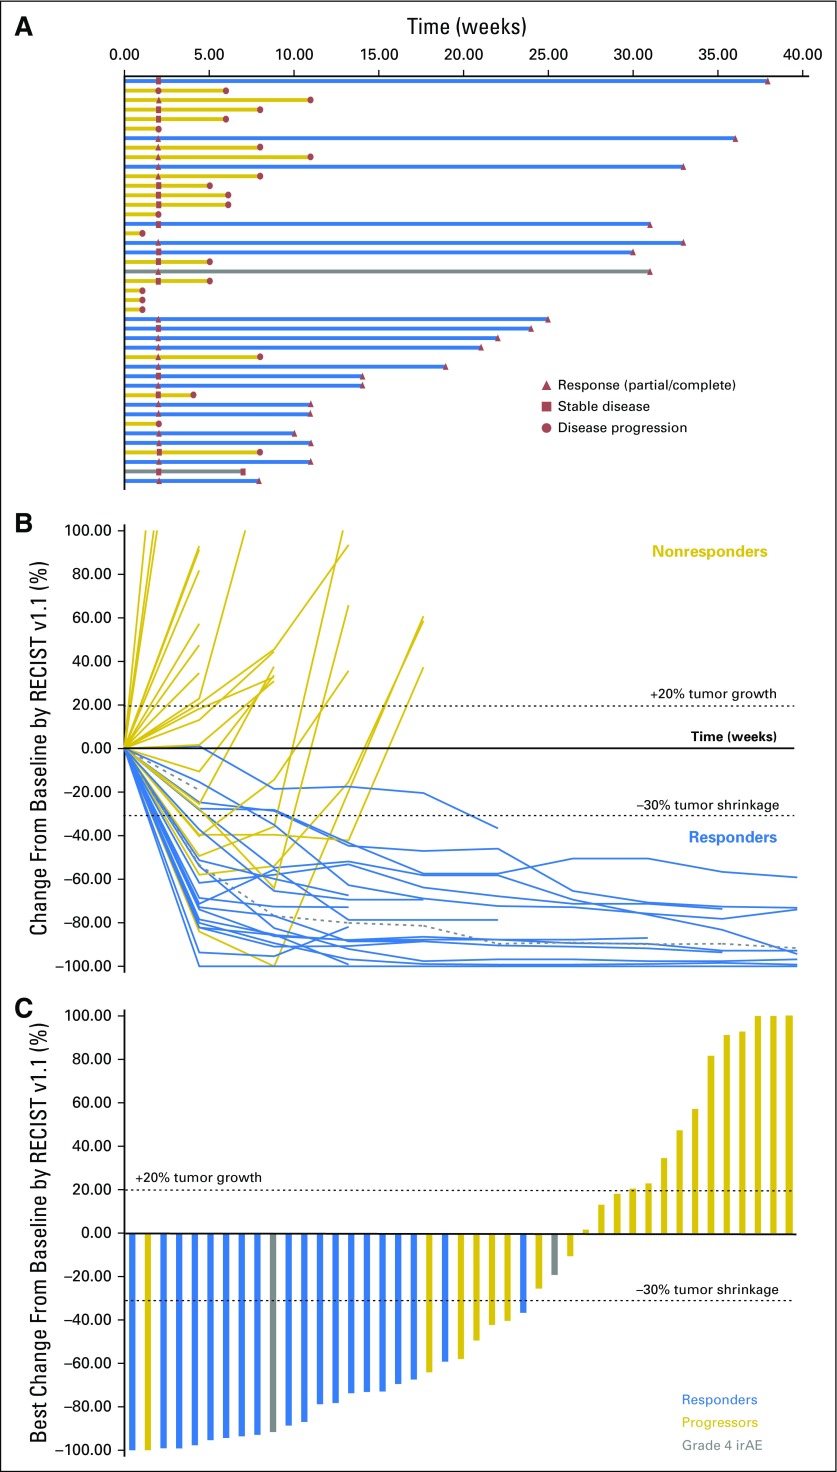
Fig 1.
(A) Treatment exposure and response duration by Response Evaluation Criteria in Solid Tumors version 1.1 (RECIST v1.1; investigator assessed; n = 43). The length of each bar corresponds to the duration of time patients received treatment (in months). Response symbols represent status at first report and at most recent review. (B) Radiographic change of tumor burden from baseline (investigator assessed per RECIST v1.1; n = 43). Two patients had ongoing responses after treatment discontinuation for grade 4 treatment-related adverse events (dashed gray lines). (C) Maximal change in tumor size from baseline (investigator assessed per RECIST v1.1; n = 43). Bar length reflects maximal decrease/increase in size of target lesion(s). Bar color reflects best overall response. irAE, immune-related adverse events.

