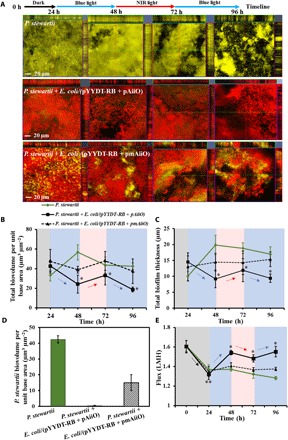
Fig. 5. Biofouling dynamics of P. stewartii in the presence of a light-responsive QQ biofilm, E. coli/(pYYDT-RB + pAiiO), and a QQ control biofilm, E. coli/(pYYDT-RB + pmAiiO), in a membrane flow cell.

(A) CLSM images of biofilms formed on the FO membrane at 24, 48, 72, and 96 hours. The blue line represents imaging after 24 hours of incubation under blue light, and the red line represents imaging after 24 hours of incubation under NIR light. Each CLSM image contains one top-down view (x-y plane) and two side views (x-z and y-z planes). Scale bar, 20 μm. (B) Total biofilm biovolume of the consortium (expressed as biovolume per unit base area). (C) Total biofilm thickness of the consortium. (D) Biofilm biovolume of P. stewartii in different consortium at 96 hours. (E) Comparisons of permeate flux through membranes at different time points. The gray, blue, and red zones represent incubation in the dark or under blue light and NIR light, respectively. Error bar represents SD. *P < 0.05 and **P < 0.005, Student’s t test.
