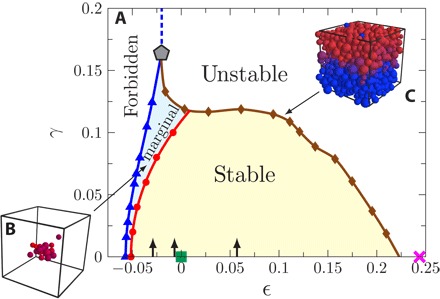
Fig. 2. Stability-reversibility map.

(A) Stability-reversibility map of the HS glass annealed up to ϕg = 0.655, obtained by the constant pressure−shear (CP-S) protocol (see Materials and Methods for the definition). The horizontal axis is the volume strain ϵ, and the vertical axis is the shear strain γ. The origin (0, 0) marked by the green square represents the initial glass without deformations. The glass remains stable only inside a region bounded by the yielding line γY(ϕg; ϵ) (brown diamonds) and the shear jamming line γJ(ϕg; ϵ) (blue triangles). The shear yielding and the shear jamming lines meet at the yielding-jamming crossover point (gray pentagon) (ϵc, γc) = (−0.020(4), 0.16(1)) (corresponding to ϕc = 0.669(3)). The Gardner line γG(ϕg; ϵ, γ) (red circles) separates the marginally stable glass phase (blue area) from the stable glass phase (yellow area). Under decompression, i.e., increasing ϵ with γ = 0, the glass becomes fully liquefied at the melting point (pink cross). In the plot, the stable, marginally stable, and unstable regimes correspond to reversible, partially irreversible, and irreversible regimes, respectively. The black arrows at the bottom indicate the volume strains used in Fig. 1 (the two arrows on the left of the green square at ϵ = −0.0069 and ϵ = −0.029, which are above and below ϵc, respectively) and fig. S1 (the arrow on the right at ϵ = 0.057). (B) The snapshot shows the particles involved in a typical plastic event in the marginally stable glass phase. (C) The snapshot shows the planar fracture structure that appears during yielding. The colors in (B) and (C) represent the relative single-particle displacement ; warmer colors indicate higher values.
