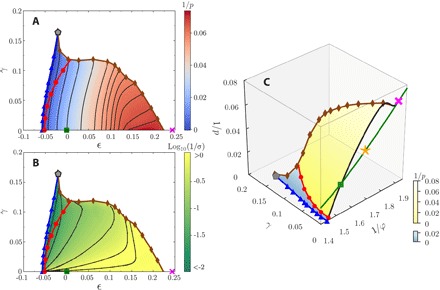
Fig. 3. Glass EOS.

(A and B) We show the G-EOSs for the pressure p = pglass(ϕg; ϵ, γ) and shear stress σ = σglass(ϕg; ϵ, γ) for the HS glass prepared at density ϕg = 0.655 by heat maps. The color bar scales represent 1/p and log10(1/σ). The thin black lines represent isobaric (constant-p) lines for p = 14.5, 15.0, 15.8, 16.5, 17, 18, 19, 21, 27, 40, 65, 160, and 1000 (from right to left) in (A) and constant-σ lines for σ = 0.3, 1, 3, 10, 30, 100 (from right to left) in (B). The data are obtained via the CP-S protocol (see Materials and Methods for the definition). (C) Three-dimensional view of the same G-EOS for the pressure (colored plane) and the L-EOS p = pliq(ϕ) (green line). Here, specific volume 1/ϕ is used instead of the volume strain ϵ. The evolution of liquid under compression/decompression follows the Carnahan-Stirling empirical L-EOS (23). The golden star represents the mode-coupling theory (MCT) transition point, which is obtained from extrapolation of the relaxation time according to the MCT scaling (23). Note that pglass(ϕg; 0, 0) = pliq(ϕg) holds by the definition of ϕg. See Fig. 2 for the meaning of symbols and fig. S9 for the cases of other ϕg and other exploration protocols.
