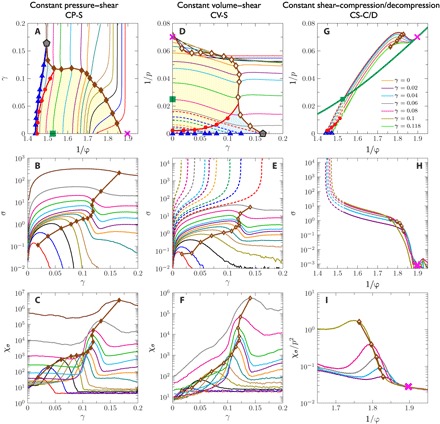
Fig. 5. Yielding, shear jamming, and melting in CP-S, CV-S, and CS-C/D protocols.

(A to C) G-EOSs obtained by the CP-S protocol for the ϕg = 0.655 system. The solid thin lines are isobaric lines for p = 14.5, 15.0, 15.8, 16.5, 17, 18, 19, 21, 27, 40, 65, 160, 1000 [from right to left in (A); the same colors are used for (B) and (C)]. The yielding line (filled brown diamonds) for the CP-S protocol is determined from the peak positions of the stress susceptibility-strain (χσ − γ) curves shown in (C). (D to F) G-EOSs obtained by the constant volume–shear (CV-S) protocol. The solid thin lines are isochoric (constant-ϕ) lines for ϕ = 0.558, 0.562, 0.568, 0.574, 0.579, 0.586, 0.595, 0.607, 0.616, 0.635, 0.655, 0.667, where the system exhibits yielding [from bottom to top in (E)]. The dashed thin lines are isochoric lines for ϕ = 0.669, 0.676, 0.679, 0.684, 0.687, 0.689, 0.692, 0.693, 0.695, where the system exhibits shear jamming [from right to left in (E)]. The yielding line (open brown diamonds) for the CV-S protocol is determined from the peak positions on the χσ − γ curves shown in (F). (G to I) G-EOSs obtained by the constant shear strain–compression/decompression (CS-C/D) protocol. The solid (decompression) and dashed (compression) thin lines represent constant-γ lines. The melting point (pink cross) is defined as the intersection between G-EOSs and L-EOS [thick green line in (G)]. The half-filled brown diamonds are the yielding line for the CS-C/D protocol determined from the peak positions on the χσ − γ curves shown in (I). See Fig. 2 for the meaning of other symbols.
