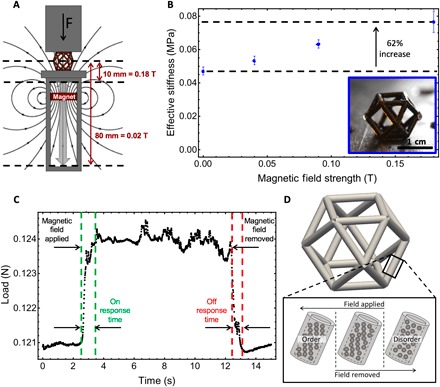
Fig. 4. Magnetomechanical characterization of cuboctahedron unit cells.

(A) Schematic illustration of the experimental setup for mechanical testing of MR fluid–filled samples with magnetic field strength controlled by translating a permanent magnet close to or away from the sample while measuring mechanical properties. (B) Plot of effective stiffness versus magnetic field strength for the cuboctahedron unit cell showing a 62% increase in stiffness from 0 to 0.18 T. Inset is an optical image of the MR fluid–filled unit cell. (C) Load versus time plot for one example of cycling a unit cell between field off (0.0 T) and field on (0.10 T) states to measure response times. (D) Schematic illustration of how the particles switch from ordered to disordered structures within the MR fluid–filled struts of the unit cells during field application or removal.
