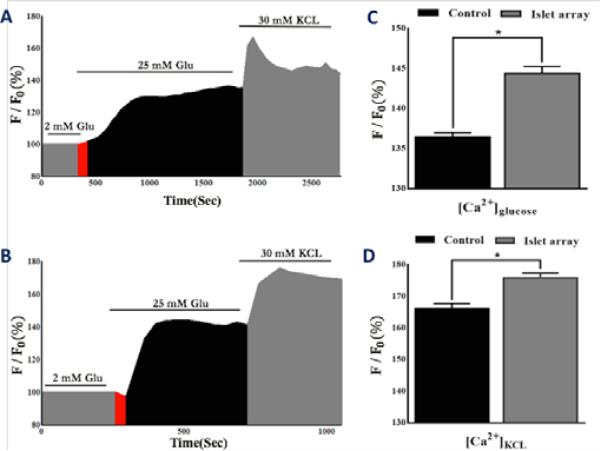
Figure 3. Comparison of calcium signalling between the perifusion-device and the islet array.
(A) Calcium profile of human islets trapped in the perifusion device in response to glucose and KCI (n = 3, total of 300 islets). (B) Calcium profile of human islets trapped in the array device in response to glucose and KCI (n =3, total of 300 islets). (C) Statistical comparison of calcium in response to glucose between devices. (D) Statistical comparison of calcium in response to KCI between devices. Red area is indicative of phase 0.

