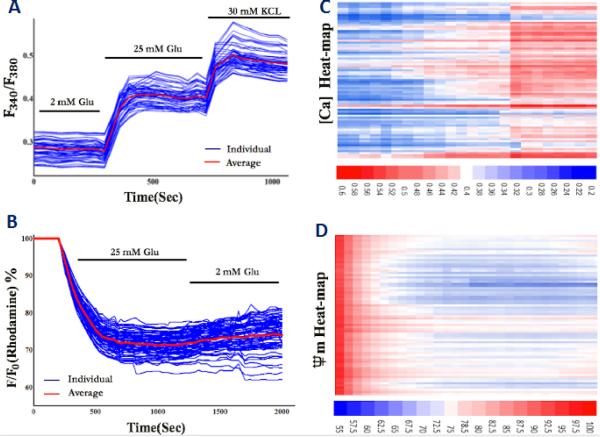
Figure 5. Variable responding profiles of human islets in response to secretagogues.
(A) Calcium signalling in response to 25 mM glucose and 30 mM KCI (n = 3, total of 300 islets). (B) Calcium concentration Heat-map in response to 25 mM glucose and 30 mM KCI (n = 3, total of 300 islets). (C) Mitochondrial potential changes in response to 25 mM glucose (n = 3, total of 300 islets). (D) Mitochondrial potential change Heat-map in response to 25 mM glucose (n = 3, total of 300 islets). Information about different response profiles of human and mouse islets in response to varying glucose concentrations and calcium-induced mitochondrial potential oscillation patterns have been presented in the SI Figures.

