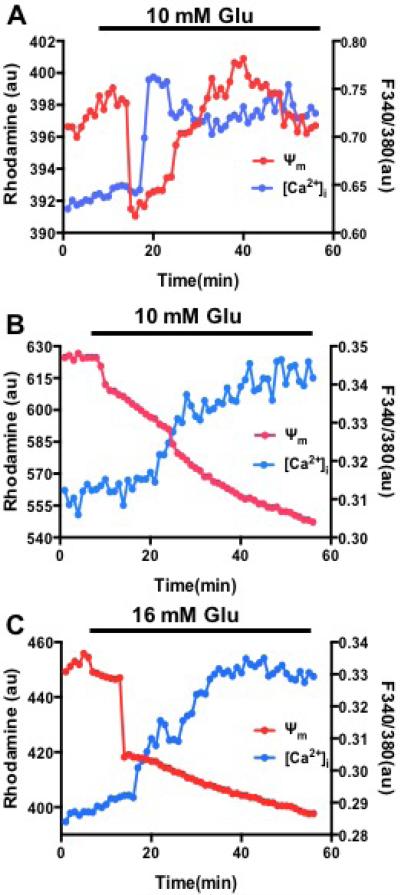
Figure 6. Spatiotemporal relationship between cytoplasmic calcium and mitochondrial potentials under glucose stimulation.
(A) Representative traces of calcium and mitochondrial potentials from mice islets stimulated by 10 mM glucose (n=20). (B) Representative traces of calcium and mitochondrial potentials from human islets stimulated by 10 mM glucose (n=15 islets of two preparations). (C) Representative traces of calcium and mitochondrial potentials from human islets stimulated by 16 mM glucose (n =15 islets of two preparations).

