
Figure 2. Resin absorbance and Z-Resolution of SL-printing.
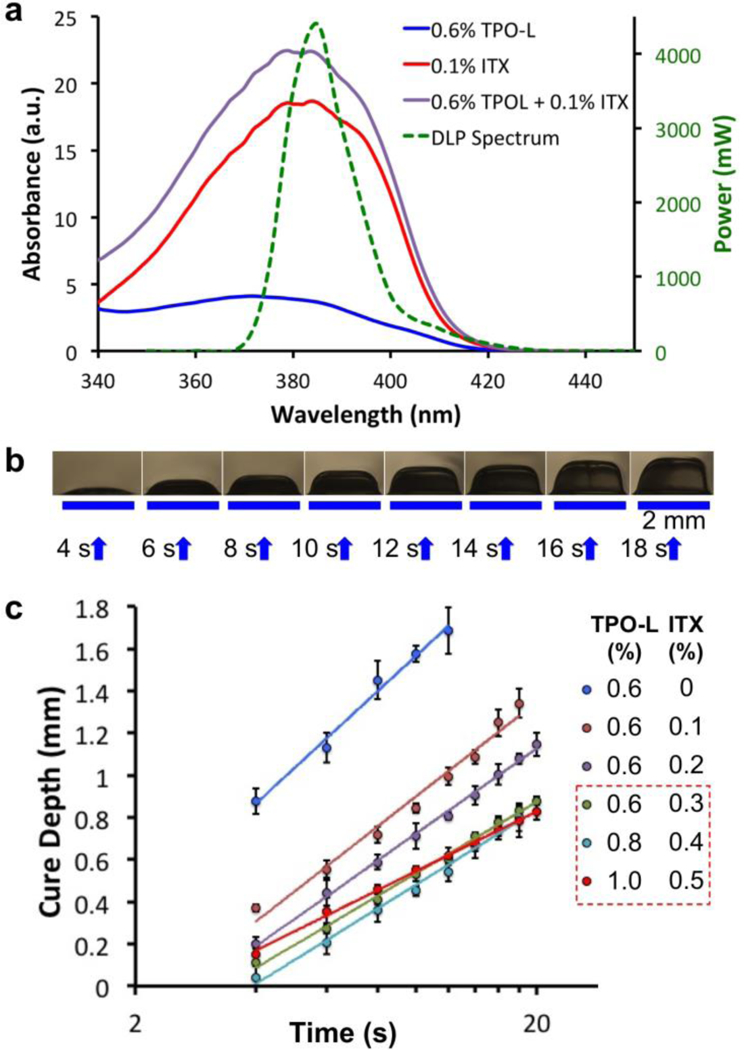
(a) Absorbance measurements of the photoinitiator TPO-L (0.6%) alone, the photosensitizer ITX (0.1%) alone and the 0.6% TPO-L + 0.1% ITX mixture, compared with the power spectrum (green) of the UV-LED source used in the DLP SL-printer. (b) Cure depth determination: 2 mm wide lines of 3DP-PDMS (with 0.6% TPO-L and 0.3% ITX) formed after being exposed with 385 nm UV for different periods of time. (c) Log-linear plot of the cure-depth versus exposure time for different concentrations of TPO-L and ITX (n ≥ 3). The solid lines denote the logarithmic fits of the data points (R2 ≥ 98.5% for all the fits). The slopes of the lines determine the characteristic penetration depth of the resins. Error bars represent SEM. Of the three resins that have the smallest slopes (boxed), we chose the mixture with 0.6% TPO-L and 0.3% ITX because it produced the most transparent prints (see text).