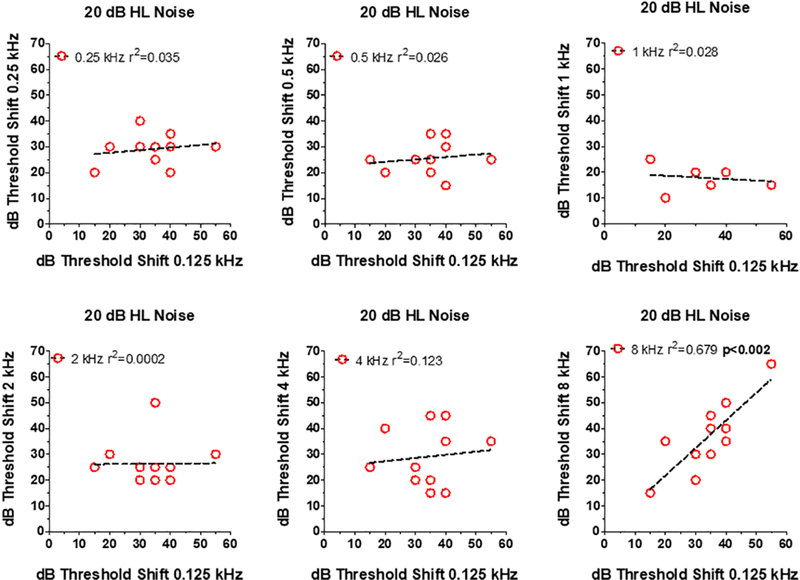
Figure 3:

Relationship between dB thresholds shift at 0.125 kHz (x-axis) in 20 dB HL noise versus thresholds at one of the other 6 test frequencies (see y-axis in each panel). Symbols show data for individual subjects. In each panel, the dashed line shows a linear regression fit to the data and the r2 value. Correlation between 0.125 and 8 kHz statistically significant (p<0.002).
