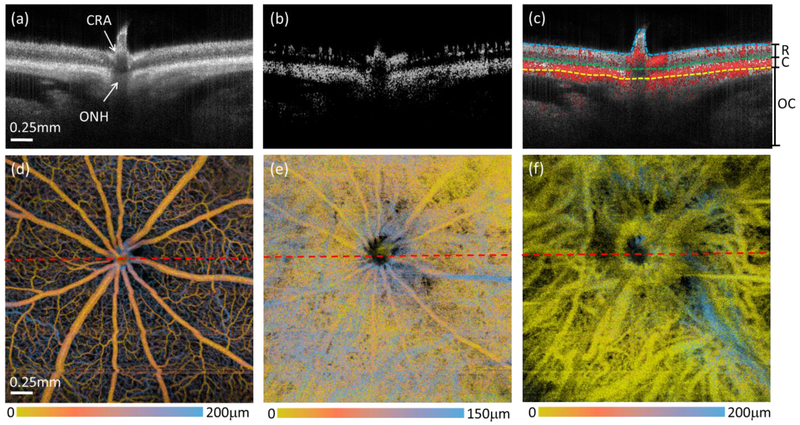
Fig. 3.
OCT/OMAG provides structure and blood flow perfusion information of the entire posterior segment of the rat eye at 10 mmHg IOP. (a-c) are the cross-sectional images of the structure (a), blood flow (b), and their overlay (c). The dashed lines in (c) are segmentation lines that depict the anterior surface of retina (cyan), the RPE (green) and the boundary between the choroid and outer choroid (yellow). (d-f) are false color en face MIPs of the blood flow in the retina, choroid and outer choroid, respectively. The color bars indicate the depth-encoded color with the depth measured from the top of the slab that was used to produce the blood perfusion maps as shown. The red dashed lines in (d-f) indicate the position of the cross-sectional images shown in the top row. CRA: central retinal artery, ONH: optic nerve head, R: retina, C: choroid, OC: outer choroid.

